Scouting: Comparing Prospect Grades With Sprint Speed
MLB started using a radar based solution called Trackman back in 2015 for player tracking and they introduced a new measurement in 2017 called sprint speed with the metric being updated in 2018. We can use this information to understand how fast a player truly is, a skill that was previously graded using home-to-first run times via a stopwatch. When the metric came out, Jon Shepherd of Camden Depot constructed a grading scale (20-80) using the mean and standard deviation of the league as a whole. Luke Siler of Orioles Hangout then used each position to calculate sprint speed grade scales for each spot on the diamond. Similarly, H.W. Lindwood updated the full scouting scale using different Statcast and more traditional metrics for player evaluation. Jeff Zimmerman has looked at different correlations with sprint speed and Alex Chamberlain has examined sprint speed with respect to wOBA and xwOBA. I haven’t seen much in comparison to prospect grades, so this post will use FanGraphs prospect data (preseason) from 2017-2020 to examine how a player’s speed grade matches with their Statcast grade (using 2020 data).
For starters, we need to understand the 2020 Statcast data with respect to scouting. The scouting scale ranged 20-80 with a mean of 50 and a SD of 10. Using the 2020 data, we get a mean of 26.8 feet/second with a standard deviation of 1.47 feet/second (the rest of this post will drop the feet/second unit but keep in mind that is the unit of measure). Using the Shapiro-Wilk normality test, we get a p = 0.020, rejecting our null hypothesis that the sprint speed data is normally distributed (we find moderate skewness at -0.27):
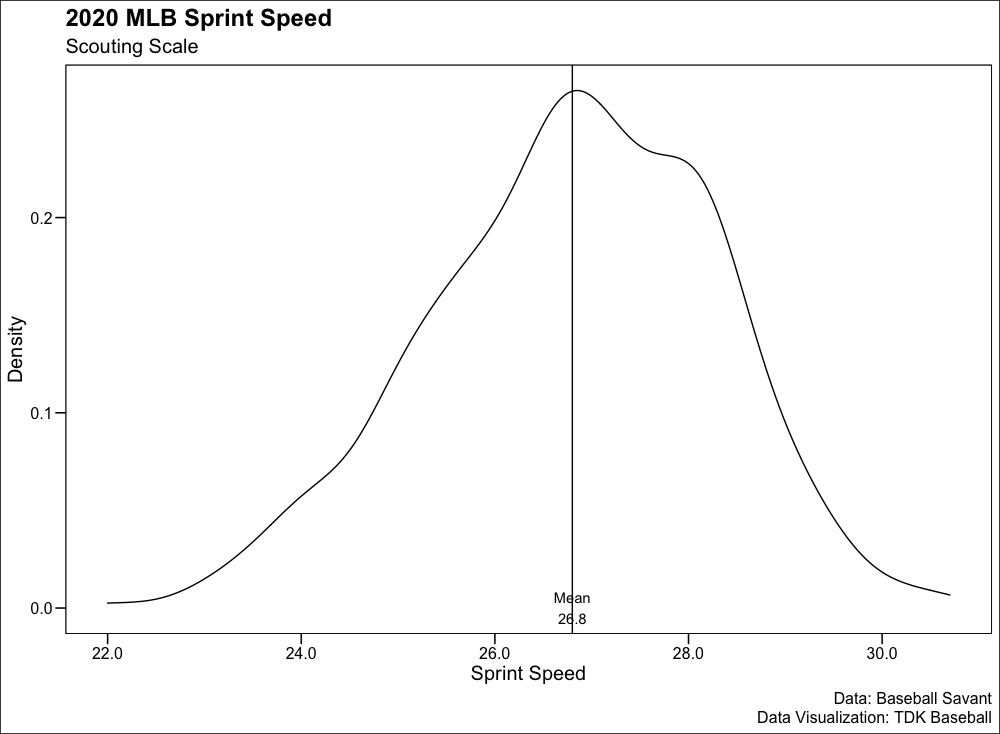
To adjust for this, we have to first normalize the data and since it is a negatively-skewed distribution (the tail is on the left), so we take the third power, bringing the skewness down to 0.02. Now that our data is close to being normally distributed, we can use the standard deviation to assign scouting grades:
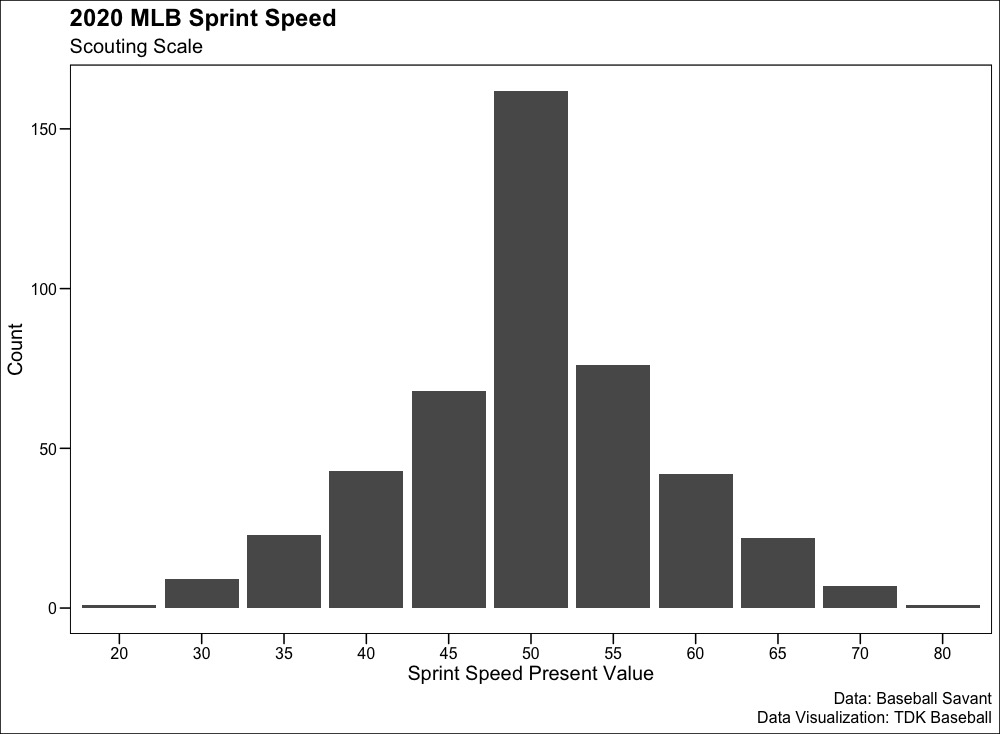
Most players in the big leagues are between -0.5 and 0.5 standard deviations (what I used for the 50 Present Value calculation). Let’s compare this with the 2017-2020 FanGraphs prospect data for Future Value speed using the most recent year for each prospect (for instance, only 2019 Bo Bichette Jr. counts).
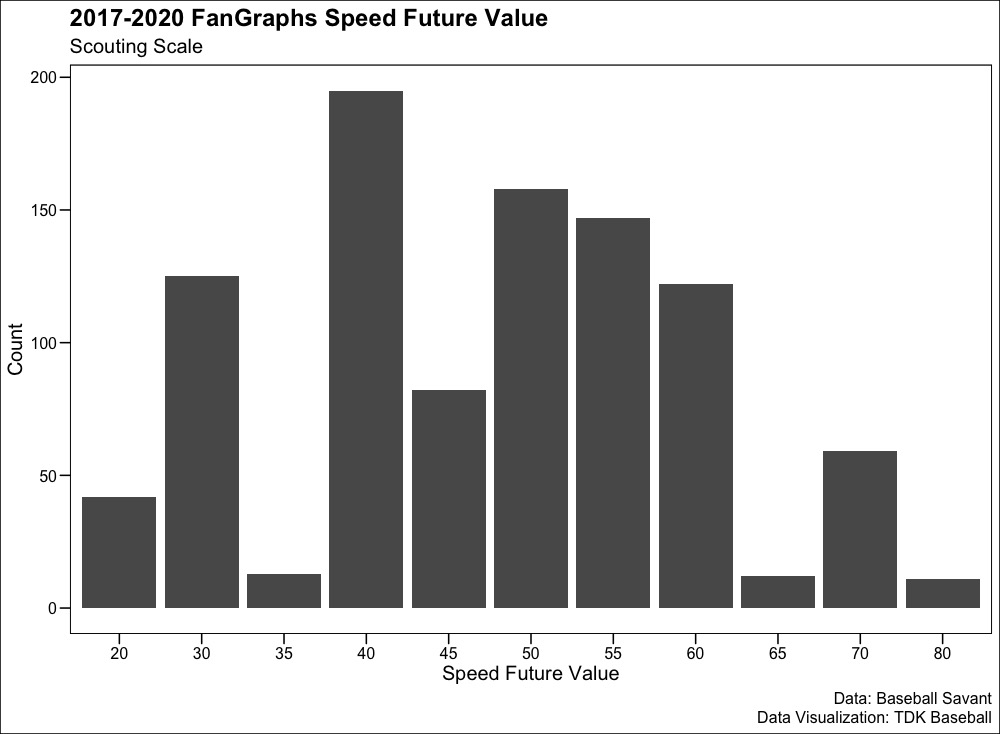
Prospects are more likely to be on the slower side than 70 or 80 grade speed as big boppers can play a nice organizational depth role as corner infielders/outfielders. We see that the data is not distributed normally as a result, and that the FanGraphs prospect team prefers giving a 30/40 or 60/70 compared to a 35 of 65. In scouting, it’s talked about not giving half grades on the ends of the scale and to be confident in your grade. As a result of this, let’s remove the 35 and 65 grades from the MLB Sprint Speed chart:
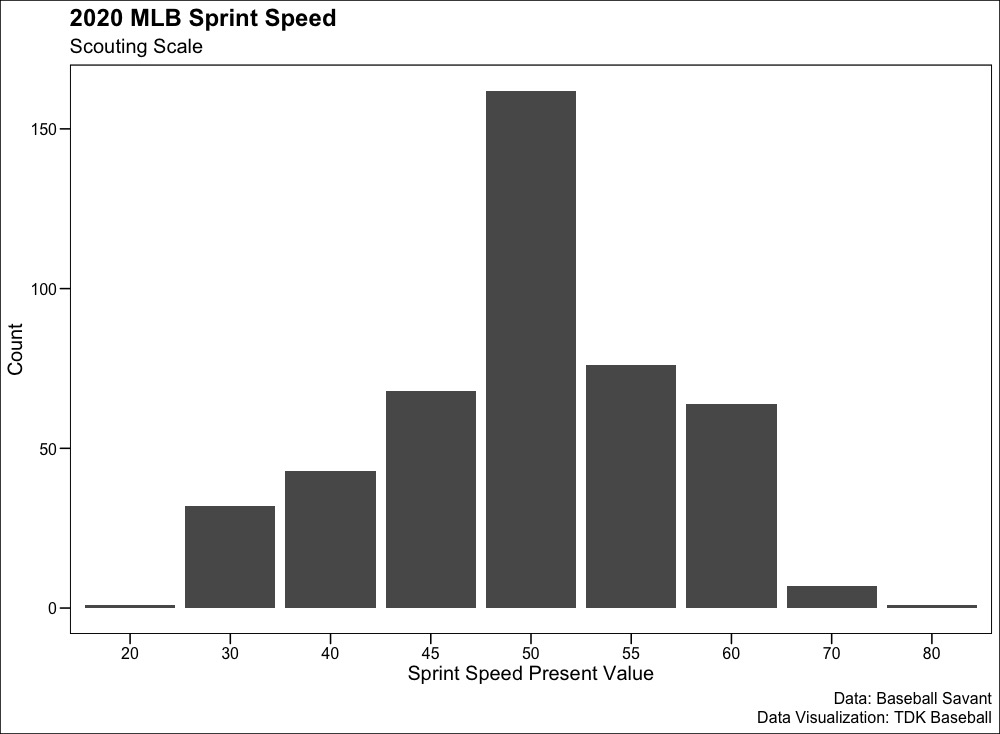
Now that we have the scouting scale for MLB Sprint Speed, we can merge the two datasets together. It is important to note that we are introducing a bias (selection bias) as the only players that can be included are those who played in the MLB in 2020 (we’re comparing future value, thus not using each individual season since 2017). We are left with 179 players who were prospects between 2017-2020 and played in 2020. Their distribution is as follows (I’ve changed every prospect run of 35 to a 30 and 65 to a 60):
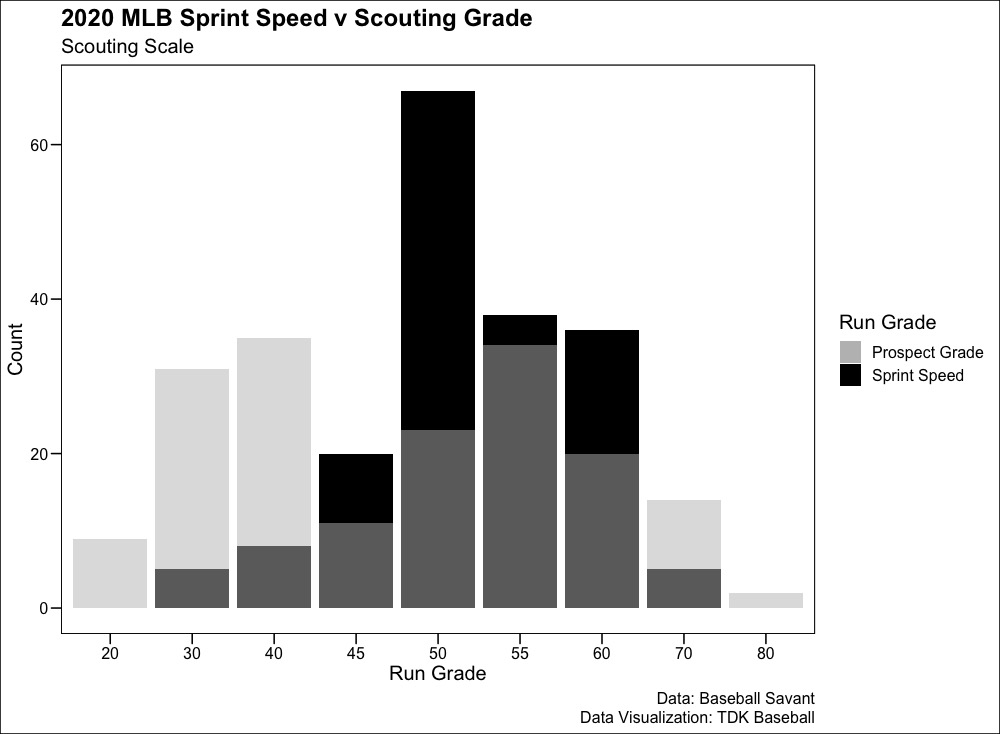
FanGraphs, of the prospects that made the MLB, still see more in the lower tiers than the 45+ while sprint speed grades are more in the 45-60 grade range. Using sprint speed, there’s more league average runners than what FanGraphs projects in their prospect grades.
The two projected 80 runners were Roman Quinn (30.5) and Adam Engel (30.3) who fall as 70 runners with their z-score of 2.86 and 2.68. The other two 70 runners using sprint speed are Anthony Alford (29.7 and z = 2.2) and Garrett Hampson (29.6 and z = 2.1). The biggest differences are Yoan Moncada and Franchy Cordero (both had FV of 70 but a sprint speed of 27.6 giving a 50 grade). On the flip side, FanGraphs saw Taylor Ward at a 30 but he has a sprint speed of 28.4, making him a 60 runner.
We can help refine and supplement the scouting process by using sprint speed (or a home-to-first from Statcast) with the scouting grade. Perhaps a runner is more likely to play harder for bang-bang plays or they have the ability to quickly accelerate allowing their speed to play up a grade. Adding objective information helps in evaluating the player.
Leave a Reply