Scouting: Estimating Raw Power With Statcast Data
Statcast has provided data from Trackman and Hawkeye that can be better used to evaluate players using quantitative data. I’ve already looked at spring speed and how it relates with the scouting grade for a player’s run with today looking at raw power estimates. In the book Future Value by Eric Longenhagen and Kiley McDaniel, they produced this chart on how to estimate raw power:
| Grade | Max Exit Velo | Average Exit Velo |
|---|---|---|
| 80 | 118 | 95 |
| 70 | 116 | 93 |
| 60 | 113 | 90 |
| 55 | 111 | 89 |
| 50 | 110 | 88 |
| 45 | 108 | 86 |
| 40 | 106 | 85 |
| 30 | 103 | 83 |
| 20 | 10 | 80 |
Using max exit velocity makes sense and it generates what looks to be about a normal distribution (using 2015-2020 data from Baseball Savant):
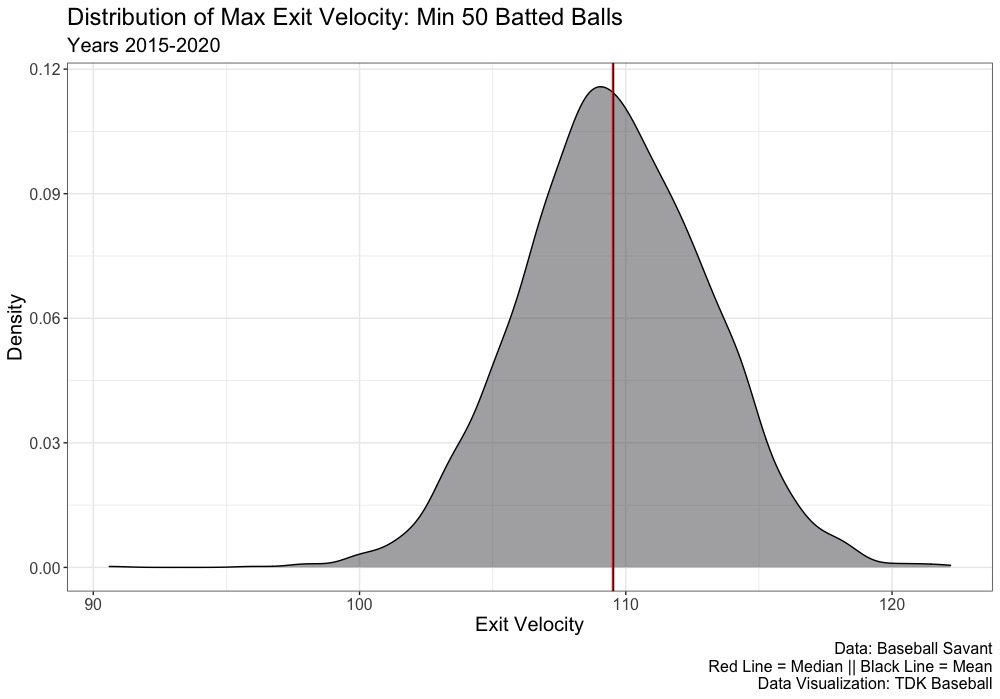
With at least 50 batted balls the goal is to eliminate the pitchers and those who lack data, though one could use a different filter (for instance, merging with PECOTA projections or other Baseball Prospectus data as they have MLBID and position) to generate the estimate. This gives a mean of 109.54 mph with a standard deviation of 3.50 mph for this sample. Generating a z-score and applying to the scouting scale (which is a normal distribution) we can get the raw power grade.
However, by just using max exit velocity there’s situations where a player might appear to have more power. Nick Madrigal had 96 batted balls and despite his average exit velocity of just 84 mph and the below distribution, he gets a 55 raw power estimate with a max of 112 mph.
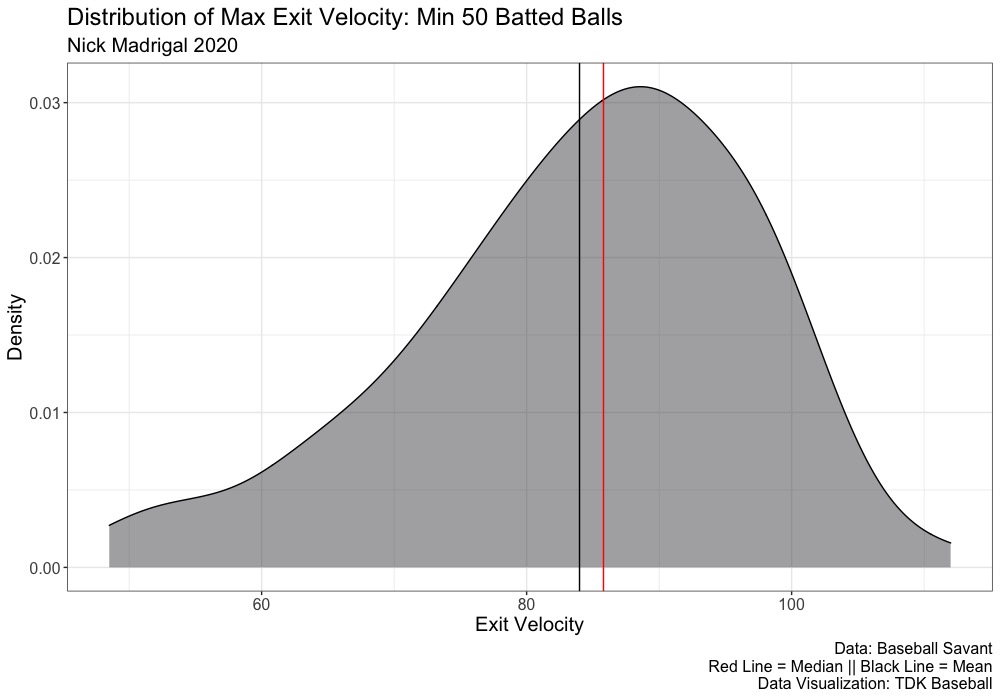
While there is some skewness of the distribution, Madrigal had five batted balls over 100 mph (5.2 percent) and ranked 341 of 351 batters in percentage of balls hit over 95 mph (20.8 percent). A 55 grade on the raw power determined by just using max exit velocity doesn’t pass the sniff test. Madrigal has elite bat control and the ability to make contact, but he has never run an ISO over .110 (highest ISO in 2019 with Double-A) at any level in professional baseball.
Instead of looking at just looking at max exit velocity, perhaps the average of the top quartile makes more sense. We again obtain what appears to be a normal distribution, which makes analyzing the data much easier as no transformation needs to be applied to make it normal.
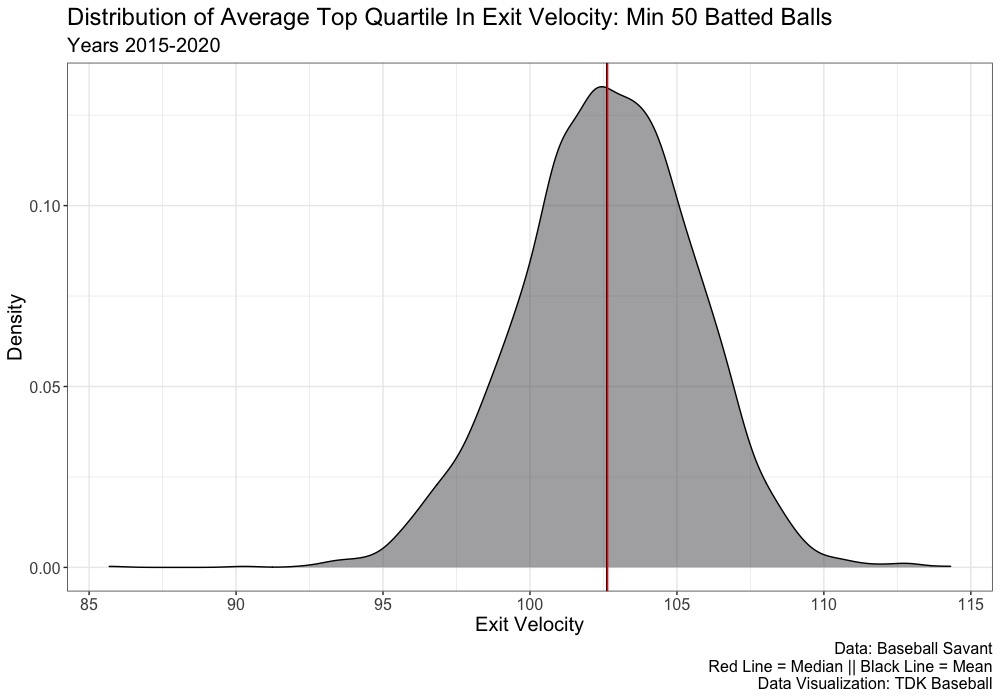
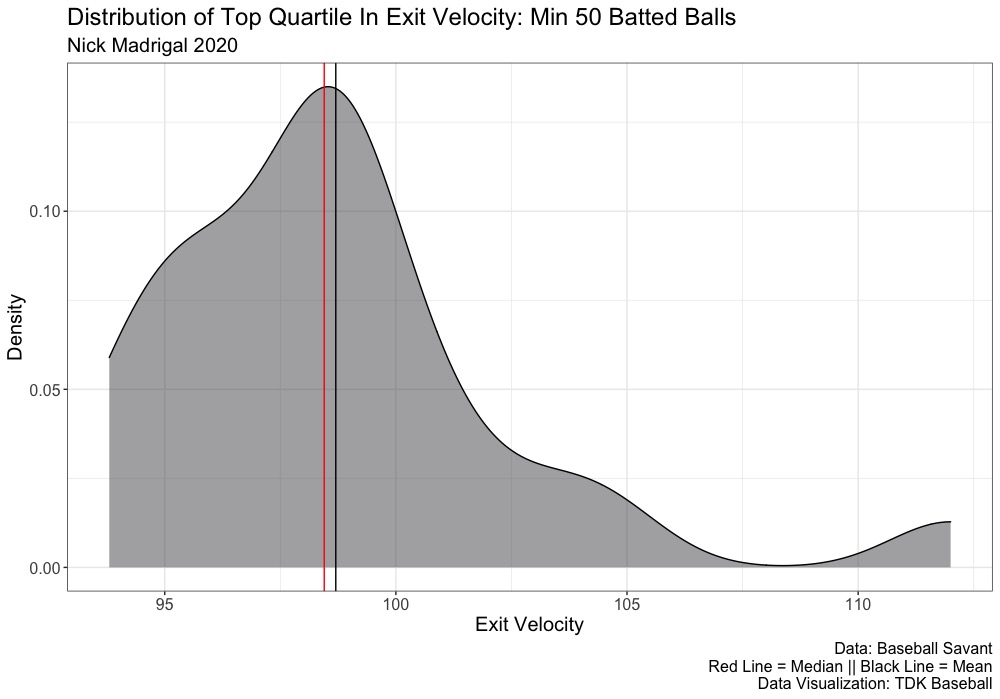
The average top quartile in exit velocity is 102.88 mph with a standard deviation of 4.11 mph. Using this, generate z-scores and apply the scouting grade gives Madrigal a 40 grade for raw power (z-score of -1.32) with a mean top quartile exit velocity of 98.7 mph with the following distribution for Madrigal’s top quartile:
The only player with an 80 raw in 2020 was Miguel Sano and Aaron Judge and Joey Gallo getting 80 grades in 2019. With Nelson Cruz signing with the Twins, there might be some concern regarding his diminishing top end power. However, he still remains 1.5 standard deviations above the mean, so he still looks like a viable power threat for at least 2021.
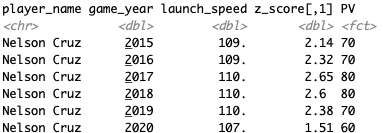
I think utilizing some cutoff – top decile or top quartile – makes more sense than just average exit velocity and the maximum exit velocity. The code to recreate this is on my GitHub account.
Leave a Reply