Coaching Decisions: Risk on the Bases
On Monday, Mike Persak of the Pittsburgh Post-Gazette wrote on a piece called “Pirates on pause: Is it time to be more aggressive on the bases?” Mike had a conclusion of “Basically, the Pirates weren’t very aggressive with stealing bases, but they were likely too aggressive on the base paths in general, leading to a lot of outs on base.” I find this to be a bit more of a fuzzy picture, as the Pirates were likely to be too aggressive on the bases but also not aggressive enough in certain situations.
Mike noted that “The Pirates accrued 60 outs on the bases, which was second most in the league.” Making outs on the bases is bad. Outs are the currency of the game and there are only 27 of them to use. But the Pirates offense was ranked towards the bottom of the league. Their non pitchers ranked 17th with a 97 wRC+ and they ranked 25th in isolated power (.162). The club did not really have the ability to hit the ball out of the ballpark, but they did rank sixth in batting average at .270. The old “manufacture runs” method is what the Pirates had to try to replicate to score runs, perhaps leading to more aggressiveness on the bases, which will ultimately lead to more outs. With apologies to Earl Weaver, the three-run home run was not going to come.
To find positive expected value decisions, we need to calculate the probability needed for a runner to be safe to create a break-even decision rule. The data needed is the run expectancy chart for the 24 base-out states, which can be found at Baseball Prospectus. Below is the table for 2019:
| Runners | 0 Outs | 1 Out | 2 Outs |
| 000 | 0.544 | 0.298 | 0.115 |
| 003 | 1.369 | 0.953 | 0.391 |
| 020 | 1.147 | 0.713 | 0.339 |
| 023 | 1.971 | 1.368 | 0.615 |
| 100 | 0.935 | 0.564 | 0.242 |
| 103 | 1.759 | 1.219 | 0.518 |
| 120 | 1.537 | 0.979 | 0.467 |
| 123 | 2.362 | 1.634 | 0.743 |
With a runner on first (100) and one out, the run expectancy is 0.564. That’s are starting base. We’ll denote the probability of being safe as p and the probability of being out then 1-p. A batter hits the ball to right, leaving the coach with the decision to have the runner stay at second or come to third. Runners on first and second (120) with one out has a run expectancy of 0.979. That’s what the left side of the equation will be. For the right side, we need to find the run expectancy of runner on first and third (103) with one out and a runner on first with 2 outs. Those values are 1.219 runs and 0.242 runs respectively. Our formula then needs to be 0.979=1.219(p)+0.242(1-p). This leaves 1.221=0.977p, or p=1.25. The runner would need a probability of being safe of 1.25, which isn’t possible. The coach should then only send the runner if the he knows the runner will be safe with probability p=1. It would appear that Mike’s conclusion is correct.
Where then should the Pirates be more aggressive? In the above link from Mike, Pirates manager Derek Shelton said, “I would rather move guys and be aggressive on the bases in terms of running hits and hit-and-runs.” But that leaves one instance where the Pirates can add some runs and be more aggressive on the bases: Sac Fly Situations.
We know from Dan Fox, who has been with the Pirates since 2008 and is now the teams’ Senior Director of Baseball Informatics, that coaches are risk averse and only send runners when the expected payoff is one run, in other words they only send runners when p=1. We also know from Fox that coaches often don’t send runners from corner outfielders (in prototypical thinking, a right fielder has the strongest arm) and that coaches often don’t see differences in risk between average and above average runners when the game is close. Russell A. Carelton, who is back with Baseball Prospectus after a season with the Mets, showed that if teams were acting optimally, the success rate on sac fly rates would be lower. In his book The Shift, Carelton discussed a model that could be created to determine the probability of a runner being safe based on hit distance and runner speed.
The data used here will be from Baseball Savant, looking at fly balls hit with less than two outs and at least a runner on third. These will be our “sac fly” situations, of which there were 5,351 of these between 2015 and 2019 (there are 6,377 when including the plays where the hit distance is null). Merging on the runner sprint speed with the runner on third player ID column, the data set now has sprint speed of the runner and the distance the ball was hit. This study, covering five years where the run environment will be changing, uses each season’s run expectancy table, like the one above. Using that table, we see that a runner on third with no outs, the probability the runner needs to be safe is the runner on third with one out = (1+run expectancy of 1 out, nobody on)p+(1-p)(2 outs and nobody on), or 0.953=1.298p+(1-p)0.115. This leaves 1.068=1.183p, p=0.90. Runner on third and no outs in 2019, the runner needs to be safe 90 percent of the time for the coach to send them. Do this for every situation, and the breakeven points can be calculated. For simplicity of the model, assume no other runners advance.
The model used is a logistic model with data being the sac fly situations where the runner was either safe (the sac fly) or the runner was thrown out at the plate (double play). This left 4,190 situations, and safe = 1 if the runner was safe, 0 otherwise.
The model is then ℓ = log[ρ/(1-ρ)]=β+αx+γy, where x is the distance the ball was hit, y is the speed of the runner, β is the intercept, and α and γ are the parameters. The below table is the marginal effects on the probability that the runner will be safe, where the two variables are statistically significant at the 1 percent level:
| Marginal Effects | |
|---|---|
| Hit Distance | 1.048*** (0.004) |
| Runner on 3B Speed | 1.197*** (0.081) |
A one unit (foot) increase in the distance the ball was hit increasing the probability of the runner being safe by 4.8 percent and a one unit (second) increase in the speed of the runner increases the probability of being safe by 19.7 percent. The breakeven formula is then x=yρ+z(1-ρ), and after rearranging, ρ=(x-z)/(y-z), where x is the current base state plus one out (runner is not sent), y is the new base state plus one run (the runner is sent and scores), and z is the new base state plus 1 out (the runner is sent but doesn’t score). The 2019 breakeven points are then:
| Runner | 0 Out | 1 Out |
| 003 | 0.708 | 0.351 |
| 023 | 0.749 | 0.459 |
| 103 | 0.739 | 0.417 |
| 123 | 0.466 | 0.506 |
Looking at the league rates we see in the following in terms of good (above expected value) and bad (below expected value) decisions:
| Year | Good Decisions | Bad Decisions |
| 2015 | 82.77% | 17.23% |
| 2016 | 81.22% | 18.78% |
| 2017 | 83.56% | 16.44% |
| 2018 | 84.29% | 15.71% |
| 2019 | 80.97% | 19.03% |
Breaking it even further in terms of sending a runner and holding a runner, we see that when sending a runner, coaches make the correct decision, but they make a bad hold about 76 percent of the time over these five years:
| Runner Sent | Runner Sent | Runner Held | Runner Held | |
|---|---|---|---|---|
| Good | Bad | Good | Bad | |
| 2015 | 99.76% | 0.24% | 22.32% | 77.68% |
| 2016 | 99.64% | 0.36% | 20.00% | 80.00% |
| 2017 | 99.63% | 0.37% | 28.09% | 71.91% |
| 2018 | 99.55% | 0.45% | 28.22% | 71.78% |
| 2019 | 99.75% | 0.25% | 19.42% | 80.58% |
Looking at the Pirates only, the two tables are:
| Good | Bad | |
| 2015 | 86.70% | 13.30% |
| 2016 | 77.40% | 22.60% |
| 2017 | 55.30% | 44.70% |
| 2018 | 83.70% | 16.30% |
| 2019 | 75.70% | 24.30% |
| Runner Sent | Runner Sent | Runner Held | Runner Held | |
|---|---|---|---|---|
| Good | Bad | Good | Bad | |
| 2015 | 100.00% | 0.00% | 20.00% | 80.00% |
| 2016 | 100.00% | 0.00% | 12.50% | 87.50% |
| 2017 | 95.00% | 5.00% | 11.10% | 88.90% |
| 2018 | 100.00% | 0.00% | 27.30% | 72.70% |
| 2019 | 100.00% | 0.00% | 18.20% | 81.80% |
Over these five years, the Pirates have had Rick Sofield (2015-2016) and Joey Cora (2017-present) as third base coaches. In Sofield’s last year and Cora’s first year, the Pirates were too passive on sac fly decisions, and held too many runners compared to their breakeven point decision. In 2017, Cora’s first year, the Pirates only made the correct decision based on expected value 55.30 percent of the time.
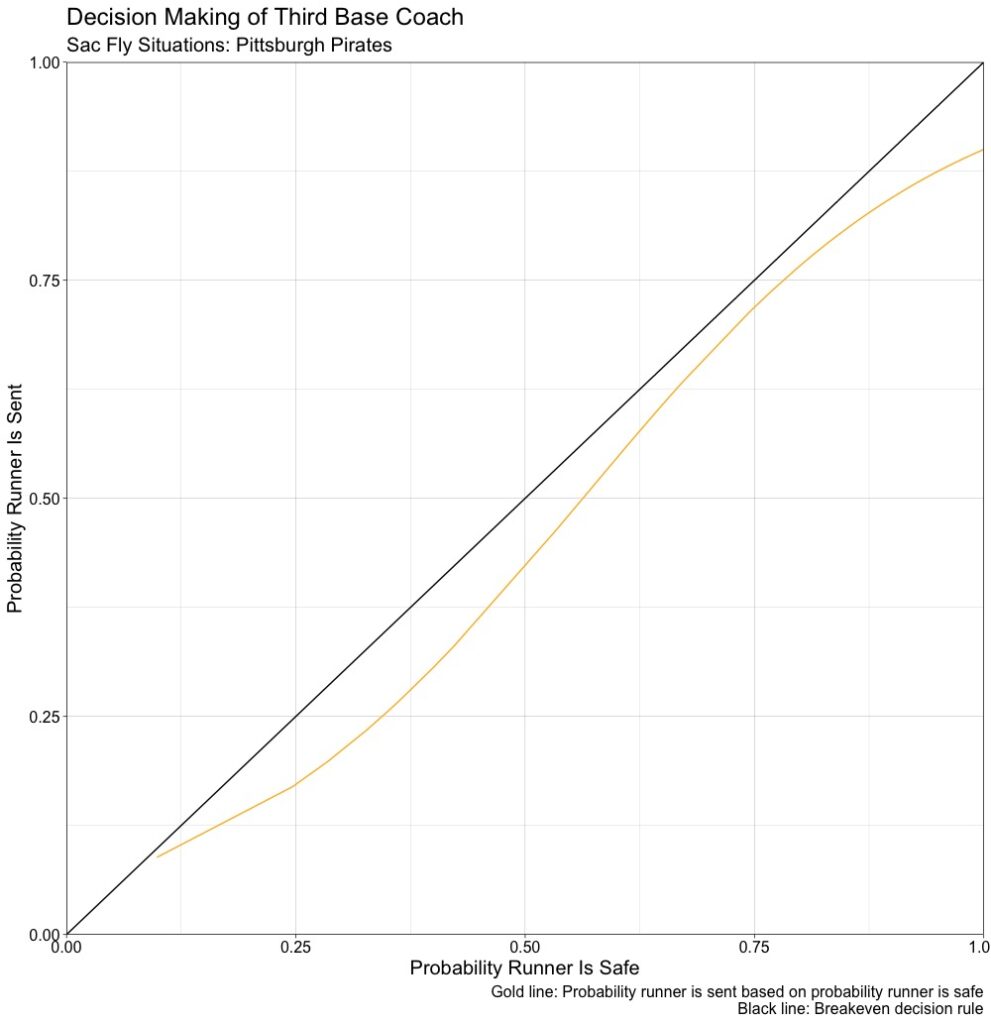
We can run a logit model on the probability of the runner being sent, replacing safe with sent=1 if runner sent, 0 otherwise. Graphing the decision, the breakeven rate, and the probability of the runner being safe, the Pirates overall graph for these years is:

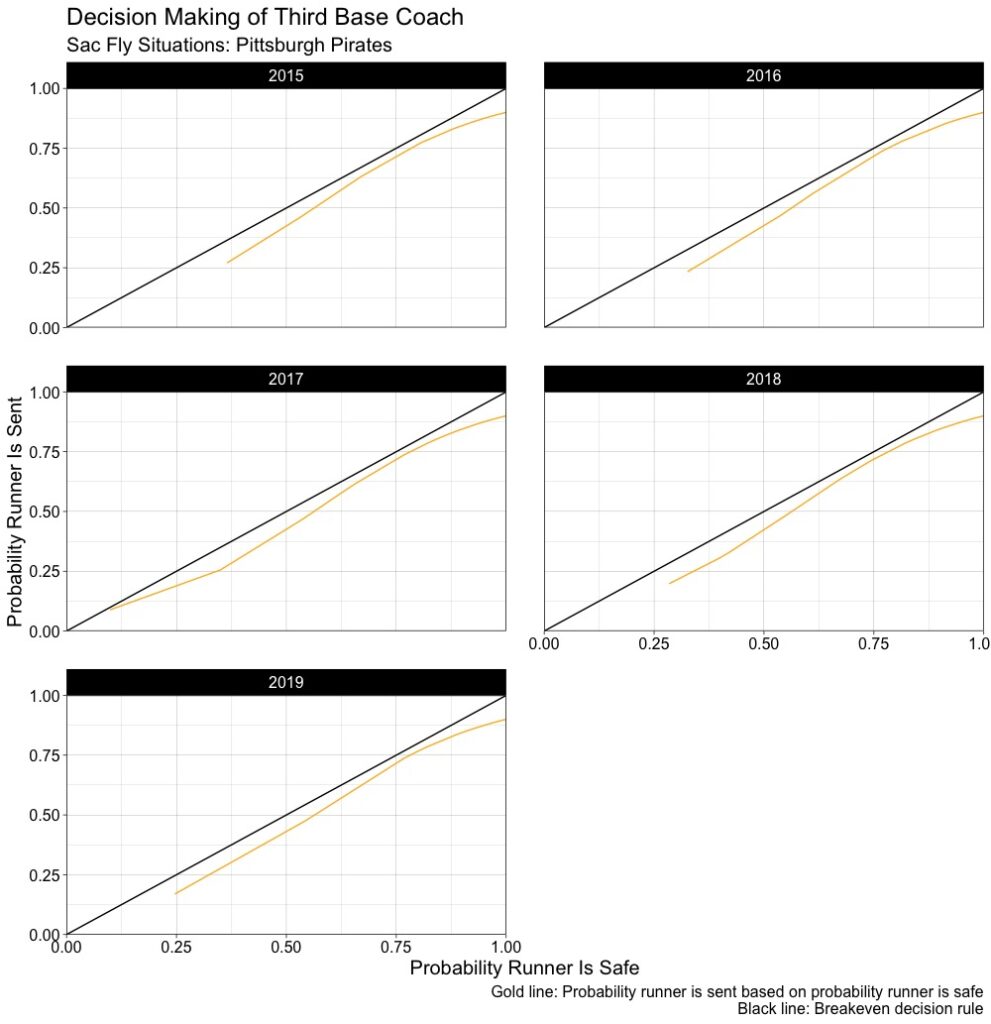
The x-axis the runner being safe and the y-axis is the probability that the runner is sent in a sac fly situation. In the five-year period, when the runner had a probability of being safe of 50 percent, the Pirates only sent the runner around 42 percent of the time. If a team was acting rational, they would send the runner 50 percent of the time, as our constant line is the breakeven decision rule. When looking by year, we get:

In a perfect world, the area under the two curves, which would capture how risk averse the coaches are, would be 0, or as close to minimal as possible. This would indicate that the Pirates, or any team, would be acting rationally with respect to their expected value. This framework can then be applied in the first to third, second to home, etc. decisions based on the time the ball is picked up by the fielder, the distance they have to throw it, the distance the runner has to travel, and the speed of the runner (and it can include the outfielder’s arm). That would require full spatial data, however.
Overall, Mike was correct that the Pirates were too aggressive in terms of base running decisions in terms of probabilistic decision making. However, an area in which manager Derek Shelton didn’t mention was sac fly decision making. The Pirates should be more aggressive in these situations, and this framework can also then be applied to other base running decisions in a full spatial data set. The sac fly decisions, where sending the runner is almost always the smart decision, is currently an inefficiency that the Pirates should try to exploit with their in-game strategy.
Leave a Reply