Baseball Theory: Real Win Cycle
In economics, the two main branches are microeconomic theory and macroeconomic theory, each having subfields such as labor economics, game theory, contract theory, applied, etc. with econometrics being the tools used to study economics. If economics is the study of people with microeconomics being the study of individual decisions and macroeconomics is large scale and general economic factors, we can assume baseball is similar to macroeconomics. This new section of the blog, which is economic theory in the macro sense but applied to baseball, will hence be called Baseball Theory.
Real business cycle, commonly of the freshwater school of macroeconomics, believe that the business cycle is caused based off a negative shock to the economy. Basically, an economy has a long run growth trend, which we usually measure in Gross Domestic Product (GDP). Around this trend are four main pillars of the business cycle: expansion where the economy grows (increasing at a decreasing rate over time), the peak (where the GDP reaches its highest point), contraction where the economy is producing less at an increasing rate, and the trough (where the GDP reaches its lowest point). The economy then starts to expand after bottoming out. You may have heard of this as the boom (period of growth) and bust (period of recession) cycle, but it’s important to note that the business cycle is only one boom and bust period.
Further, the negative shock to the economy can be thought of something that hampers production. The best example, currently, would be the pandemic which has hurt production factors and there are people looking for work. Looking at the total nonfarm payroll of all employees from the Federal Reserve Bank of St. Louis, we can observe this business cycle.
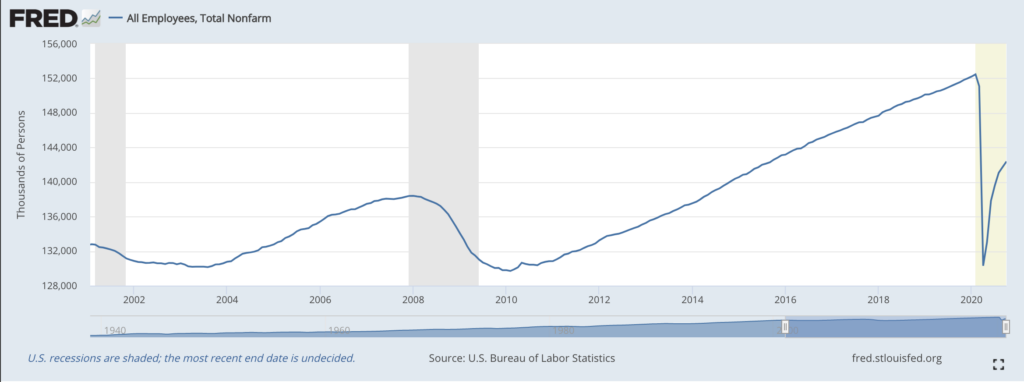
The grey bars represent periods where there is a recession, and by looking at the graph, we can see the real business cycle (as described above) in action. If the economy cycles, certainly a baseball team does. We hear about windows in baseball, with some organizations such as the Pittsburgh Pirates under Neal Huntington not being believers. But winning has a reward and price, and it depends on where you are at on the win curve. A team that is a borderline playoff team (the Cleveland Indians, Philadelphia Phillies, etc.) should spend more to acquire wins (in terms of dollars and prospect capitals) compared to a team such as the Los Angeles Dodgers, who are all but guaranteed a seat at the playoffs. New President of Basketball Operations for the Philadelphia 76ers Daryl Morey recently said “I start with championship probability and basically work backward from that. Over a time frame of 1-3 years…” Morey is recognizing the championship window and how to maximize the odds given that. The 76ers will peak at some point before a decline in performance, be it via injuries, stagnation, or players leaving via free agency.
Despite the Pirates not believing in windows, the club saw a “negative shock” under Huntington when Andrew McCutchen posted a 105 wRC+, Gerrit Cole a 3.88 ERA and Francisco Liriano a 5.46 ERA in 2016 after three postseason runs. Their farm system has taken a hit, and the team had the worst record in baseball last year. As another example, let’s look at the Minnesota Twins, Tampa Bay Rays, Cleveland Indians and Oakland Athletics since 1990. We’re going to draw our horizontal line (think long run GDP) at 0.543 since we know 88 wins is when a team has greater than 50 percent chance at making the playoffs.
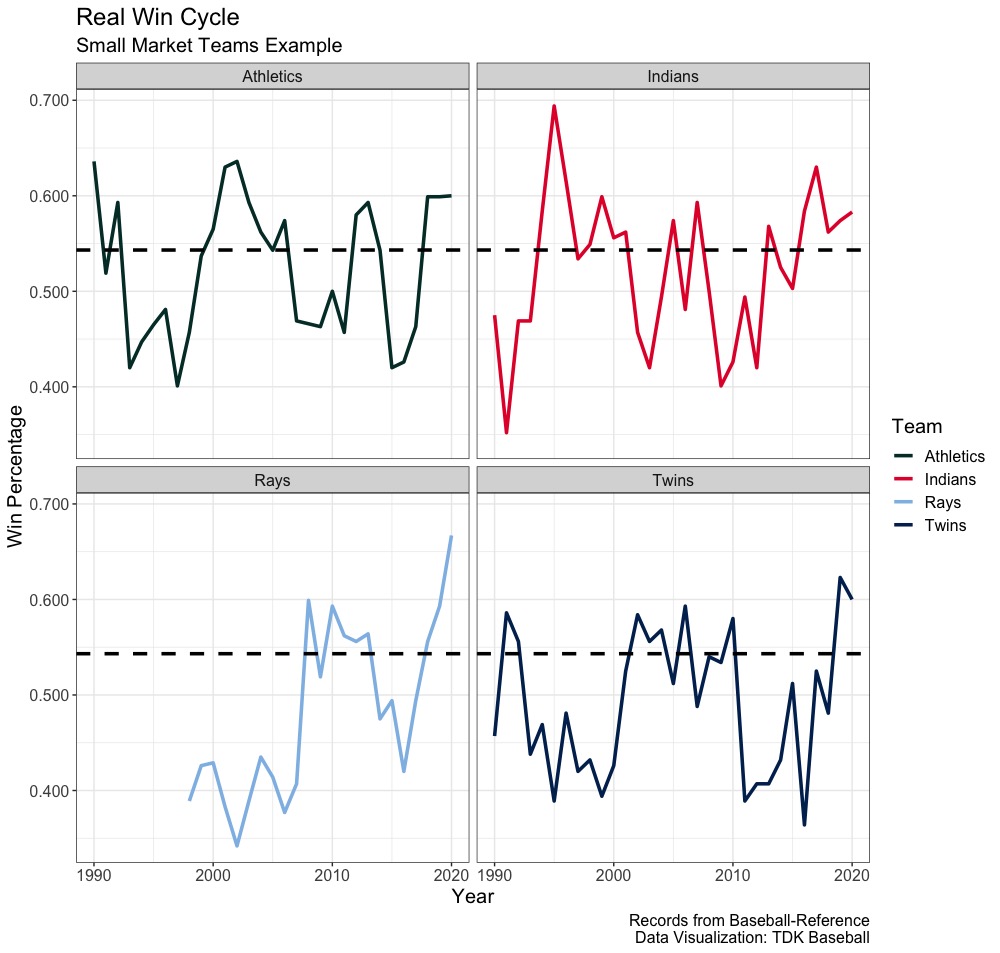
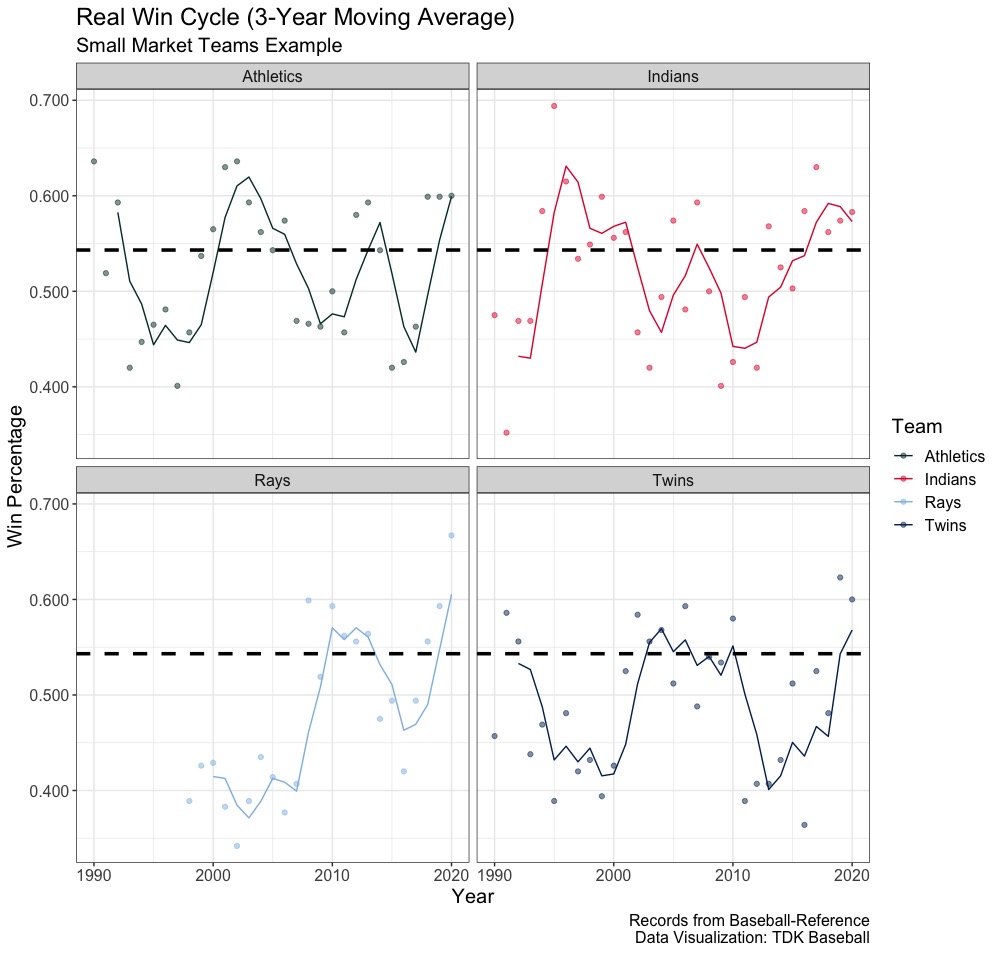
That certainly looks similar to the real business cycle, where the teams win percentages rise and peak for a few years before coming back down. Since about half of the competitive windows (what we amount to be the expansion and peak) last two, three or four years, the below is a three year moving average of the above:
A lagging variable is a variable that has a delayed reaction to a change in the business cycle (win cycle) and unemployment is usually the biggest example. For baseball, we can think of it as payroll. A younger team in a small market will likely show growth in the expansion period, winning more games than expected and developing into good baseball players. After this team has shown what they are capable of, then the team surrounds it with external talent by investing capital into the team. The amount a team pays in free agency or trade is usually done after expansion has started.
A leading variable is a variable that indicates a positive economic outlook, going from trough to expansion, with consumer confidence being one of the best tools for future economic activity. If the consumer is willing to spend more, it’s believed to be seen as a positive outlook on the economy. Similarly, teams build through the draft and trades, so their farm system ranking should signal when a team will be ready to compete again. A stronger farm represents a brighter future whereas a weaker farm brings bleaker hopes.
Since 2010, in which Forbes has data for payroll, a look at the payroll rank and farm rankings from Baseball America compared to record rank shows the following:
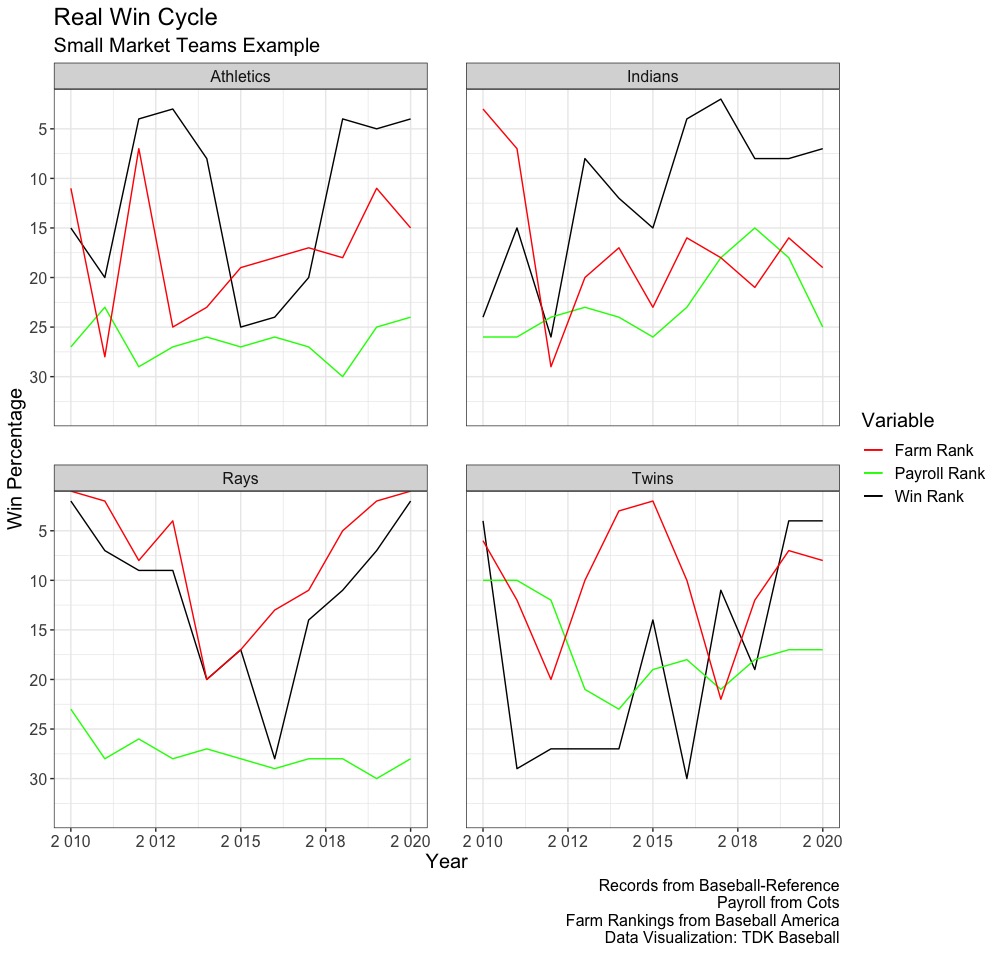
Generally, what we see is that when the team starts winning, they are more willing to invest in payroll as payroll is dictated ahead of season. The Indians example is the best at showing this, investing more into the club post World Series but as their three year moving average inches closer to the line, the club has started to invest less. The Twins, after reaching the playoffs in 2017, decided to increase payroll in 2018, an example that payroll is lacking. In terms of farm systems, the Athletics farm ranking (defined before the season) increases before they peak in wins and before the club bottoms out, their farm begins to improve. While the Rays farm system keeps improving, they too are close to reaching the peak before their farm will start to fall off with the graduation of their top prospects.
***
Sustained success is hard; teams are going to cycle through their position in baseball over a time period. It reflects usually the structure of the business cycle, and as such we can view the baseball win cycle (window) similarly to the real business cycle. To conclude, let’s define terms and the real baseball cycle.
- Leading variable: Indicates future success. This would include the farm system ranking and investment into player development tools (new technology)
- Lagging variable: Follows the initial success. This would include payroll, as the team will start to spend more after realizing the development at the Major League level
- Negative shock: A valuable player becomes injured or performs below their expectation, the development system no longer produces elite talent, a member of the organization leaves for a new organization, or a player leaves in free agency. This negative shock leads to a downturn in the club’s longterm outlook for a championship
- Expansion: The acquires minor league depth and develops them, improving their farm system and infrastructure. The team starts to develop at the Major League level and wins baseball games at a higher rate than expected. The competitive window is opening
- Peak: The highest championship (we defined as playoff above in our graphs) probability a team achieves in their window. At this point, the club has their strongest team before hitting the age curve and seeing a decline in production. Timing the peak correctly in terms of investing should yield the best results
- Contraction: The club starts to see some attrition to their roster via increasing player costs and players leaving in free agency. This is usually when a player is in their final year or two of arbitration and are more costly to the team. With no readily available replacement without significant investment, the team starts to play worse and worse resulting in trades of established players
- Trough: The bottom point of a team’s rebuilding process. The previous core is stripped away, and the club is acquiring prospects and losing games at a high rate. The prospects are further away from the Major Leagues, but the player develop programs will lead to the expansion phase. As the prospects are in the upper minor leagues and are ready for the Major Leagues, the team’s future is looking more promising
In an ideal world, the team would start to invest heavily right before the peak to maximize their championship window for an extended period of time. Instead of being a lagging variable, one inefficiency in the market is to invest a year or two before the club is officially ready. This will delay the peak, but given budget constraints, maximizing when a player has four to five years of club control left is better than when that player has two to three years.
Baseball cycles, at least for clubs with more of a budget constraint, follow the real business cycle. While the Pirates former general manager didn’t believe in championship windows, the team saw a negative shock and went from the second best record in baseball in 2015 to not having a playoff appearance since and the worst record in baseball in 2020. Sustaining success sounds good in theory and even better in practice, but some form of negative shock to their organization will occur, and as such a period of contraction will follow. Businesses cycle and so do baseball teams.
Leave a Reply