Analyzing Pitchers: Supplementing DRA with Statcast Data
Baseball Prospectus released their new version of a runs allowed estimator back in 2015. The new measurement called Deserved Run Average (DRA), is a mixed model controlling for various factors (adjusts for context such as score and catching framing for instance), where areas such as FIP and xFIP ignore. In conventual DIPS theory, pitchers have no control of batted balls and is why FIP only includes strikeouts, walks, and home runs. However, a pitcher who leaves fastballs up in the zone will likely have harder contact against and controls for all batted ball events (BBE). With their update in 2017, we see that DRA is better at describing the current RA9 (runs allowed per nine innings), is more stable year-to-year (reliability), and is more predictive of the following seasons RA9 (out of sample prediction) than FIP:

One of the benefits of DRA is that the Baseball Prospectus team provides the standard deviation (SD) of the model; while Stephen Strasburg led all of baseball with a 2.13 DRA (3.40 RA9), by how much better was he than Jacob deGrom and his 2.27 DRA (2.60 RA9) and Gerrit Cole’s 2.36 DRA (2.80 RA9)? We can plot the distribution of their RA9 using the SD that Prospectus provides us with the mean line:

We see there’s not much difference in spread between the three; deGrom has more in the tails than both pitchers, his SD of 0.57 is the highest of the three, indicating that there’s more variance in the model for deGrom. We’re less confident that deGrom is a true 2.27 RA9 than we are Cole is at 2.36 and Strasburg is at 2.13. Using the trapezoidal rule from calculus, we can get the area underneath the normal distribution and subtract from 1 to get the probability Strasburg was no better than deGrom at about 75 percent.
Prospectus also provides the run components for DRA; Not-In-Play Runs (NIP Runs), Hit Runs, and Out Runs, along with framing. NIP runs measures models walks, hit-by-pitch and strikeouts; Hit Runs measures the amount of damage, i.e. who suppresses power the most; Out Runs measures most batted balls and is the “pitcher’s ability to generate typical outs on balls in play.”; Framing measures how much a pitcher benefits from a catcher’s framing. For the three above in 2019, we see the following breakdown:
| Player | NIP Runs | Hit Runs | Out Runs | Framing |
|---|---|---|---|---|
| Strasburg | -29.7 | -31.1 | 5.3 | 0.7 |
| deGrom | -32.4 | -27.4 | 5.2 | -0.5 |
| Cole | -44.7 | -25.1 | 16.2 | 0.1 |
Cole appears to be the biggest power pitcher, which aligns with the 39.9 percent strikeout rate and 5.9 percent walk rate. However, in normal balls in play, Cole was the worst of the three and him and deGrom were similar in how much damage was allowed. Cole’s strong DRA really comes from his ability to limit walks and strike out near 40 percent of hitters. The last column, framing, is how much a catcher steals a strike and the impact that has. Using Baseball Prospectus’ framing runs model, we get the following chart +/- one standard deviation in framing runs in 2019.
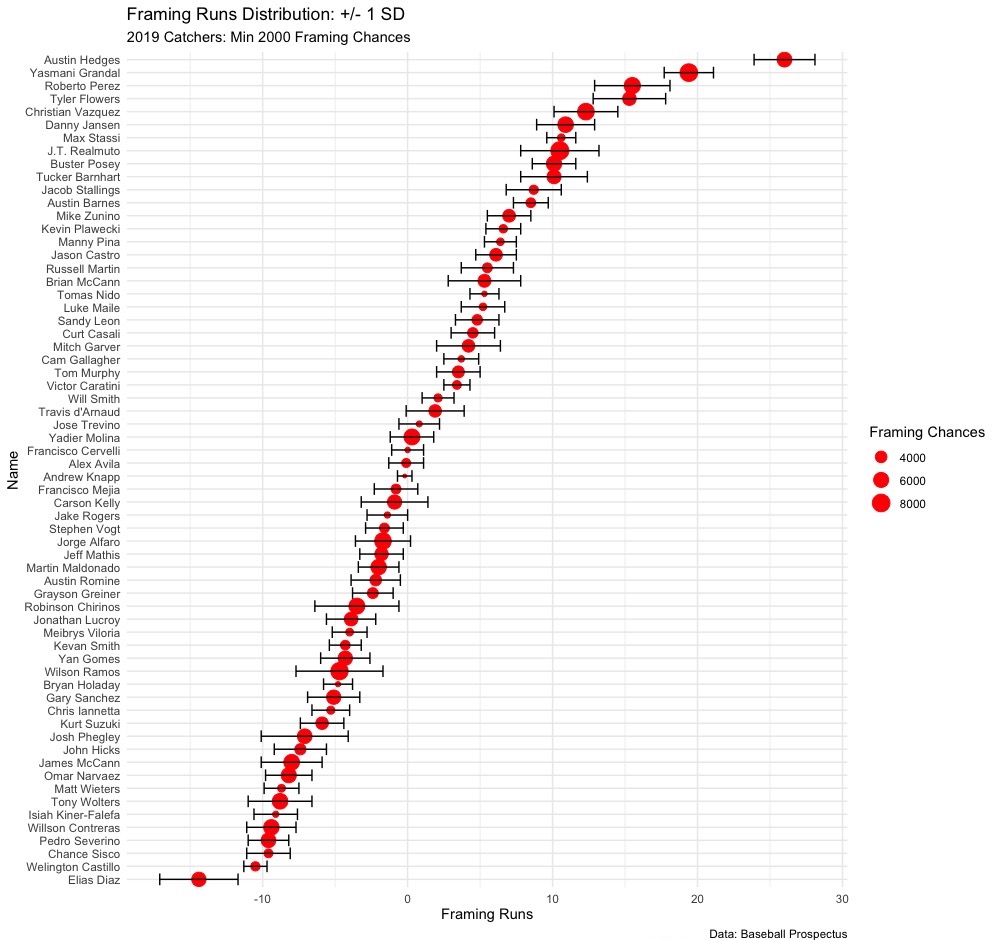
Cole, who mostly threw to Martin Maldonado and Robinson Chirinos, had poor pitch framing with neither providing zero framing runs when including one SD, however he did throw five games to Max Stassi, who ranks seventh and we do thing pretty certainly that he’s a positive pitch framer. Strasburg mostly threw to Yan Gomes and Kurt Suzuki, who both grade negatively. deGrom threw to Wilson Ramos, who is a poor framer, but also Tomas Nido, who appears to confidently be above average.
Understanding the pitchers and using a metric to try to isolate skills is part of the story. Providing the standard errors and the components lets us look at the specific areas of why a model likes the pitcher. But there’s also times where the model might be higher on a pitcher than the numbers that have been produced. Here’s an example.
Joe Musgrove and DRA
Joe Musgrove’s RA9 every year since 2017 have been: 4.86, 4.37, 5.18, and this year in three starts 6.75. Back in 2017 with the Houston Astros, Musgrove lost a spot in the starting rotation and was bumped to the bullpen. With Baseball Prospectus releasing their 2020 DRA estimates, Musgrove’s distribution over 10,000 simulations is:

The DRA numbers don’t match the RA9, they’ve been 4.49, 3.43, 3.59, and 7.42. Before this season, Musgrove has had indicators that he’s been much better than what his RA9 has shown. Last season, based on his DRA and the SD, the probability his true talent RA9 was worse than 4.89 (the league average starter RA9) was 2.98 percent. In 2019, he threw his most innings to Jacob Stallings (a plus framer) but also threw 30 percent of his innings to, confidently, the worst framer in Elias Diaz.
In terms of being a power pitcher, Musgrove struck out 21.9 percent of hitters (about the league average of 22.3 percent by starters) and limited walks at a 5.4 percent clip. His NIP runs were -9.9. He didn’t allow home runs, just a rate of 2.9 percent compared to the average of 3.8 percent and his Hit Runs were -8.2 runs. The Pirates right hander was also in the 62nd percentile in barrel percentage per Baseball Savant, with an Out Runs of -7.2. All of this production led Musgrove to the 3.59 DRA (74 DRA-) and 4.02 WARP (+/- 1.27).
This leads to the question on how Musgrove pitched to such a high RA9. To answer this, I will be using the Baseball Savant data to try to figure out the reasoning while using the scouting scale that I used when looking at Griffin Canning, Mitch Keller, and JT Brubaker.
Joe Musgrove Pitch Profile
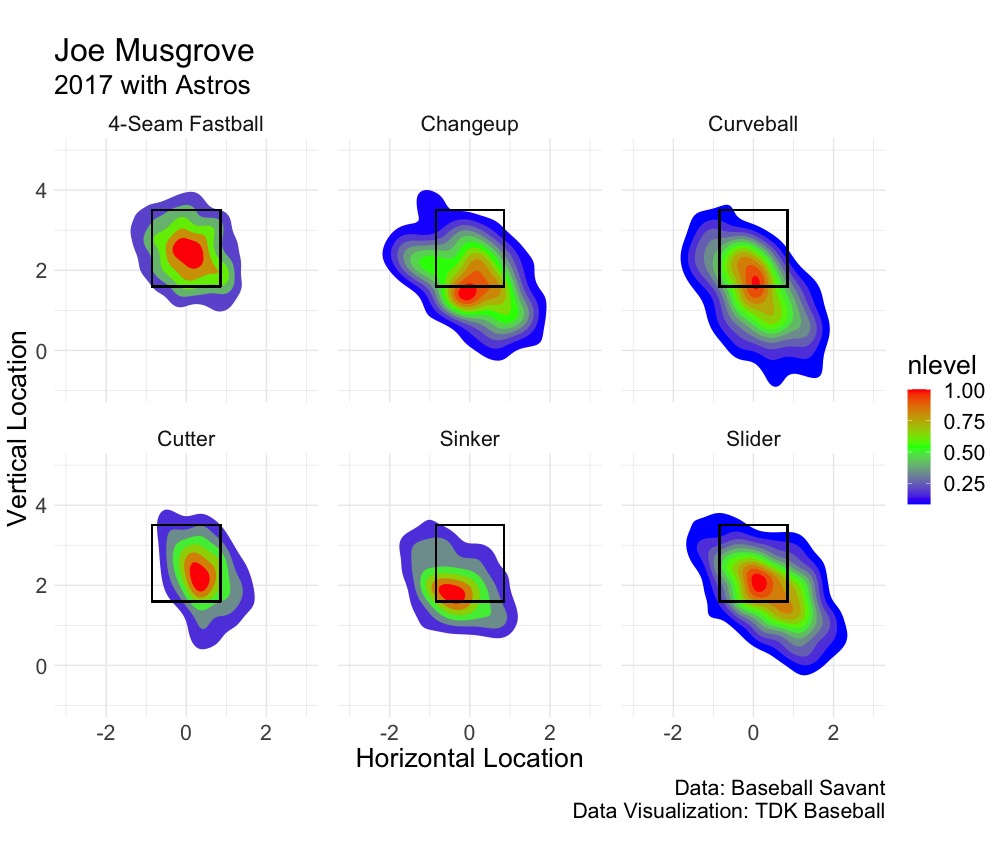
With the Astros in 2017, Musgrove was mostly a four-seam and slider guy who mixed in other pitches, but has since started to throw the curveball and changeup into the mix as well:
| Pitch Name | 2017 | 2018 | 2019 | 2020 |
|---|---|---|---|---|
| 4-Seam | 40.6% | 32.0% | 37.6% | 31.8% |
| Changeup | 9.7% | 14.0% | 10.6% | 13.9% |
| Curveball | 9.4% | 2.2% | 9.5% | 16.8% |
| Cutter | 4.7% | 15.4% | 8.4% | 7.6% |
| Sinker | 8.2% | 17.8% | 11.9% | 7.3% |
| Slider | 27.4% | 18.7% | 22.1% | 22.6% |
When Musgrove came over, his sinker usage rose to around 18 percent with the 4-seam dropping to 32 percent, a staple with Neal Huntington as General Manager and Ray Searage as pitching coach. In the summer of his first year as a Pirate, I did take a look at the pitch mix and the slider/curve combo and did conclude that he probably was throwing the cutter too often compared to the optimal rate.
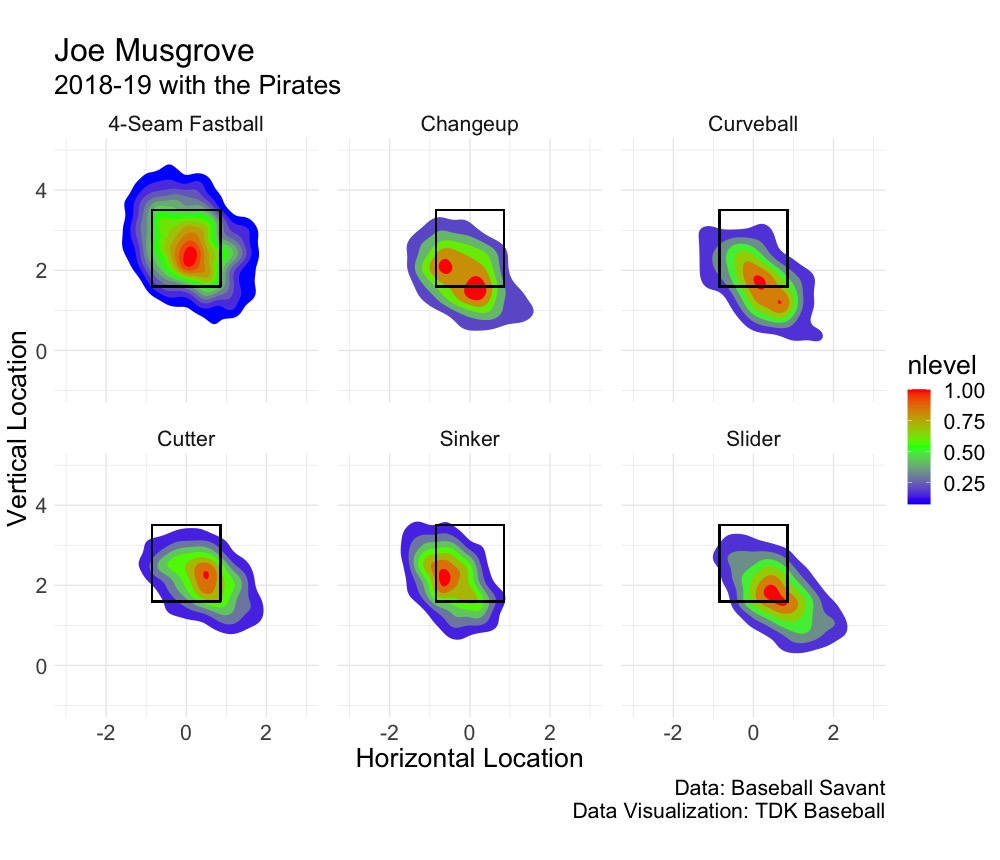
With the Astros in 2017, Musgrove was unable to bury the sinker down and into the arm side and the slider down and into the glove side as he as did in 2018-19 with the Pirates. The changeup seems to be more well executed while the fastball is left middle-middle well too often (from catcher’s point of view):
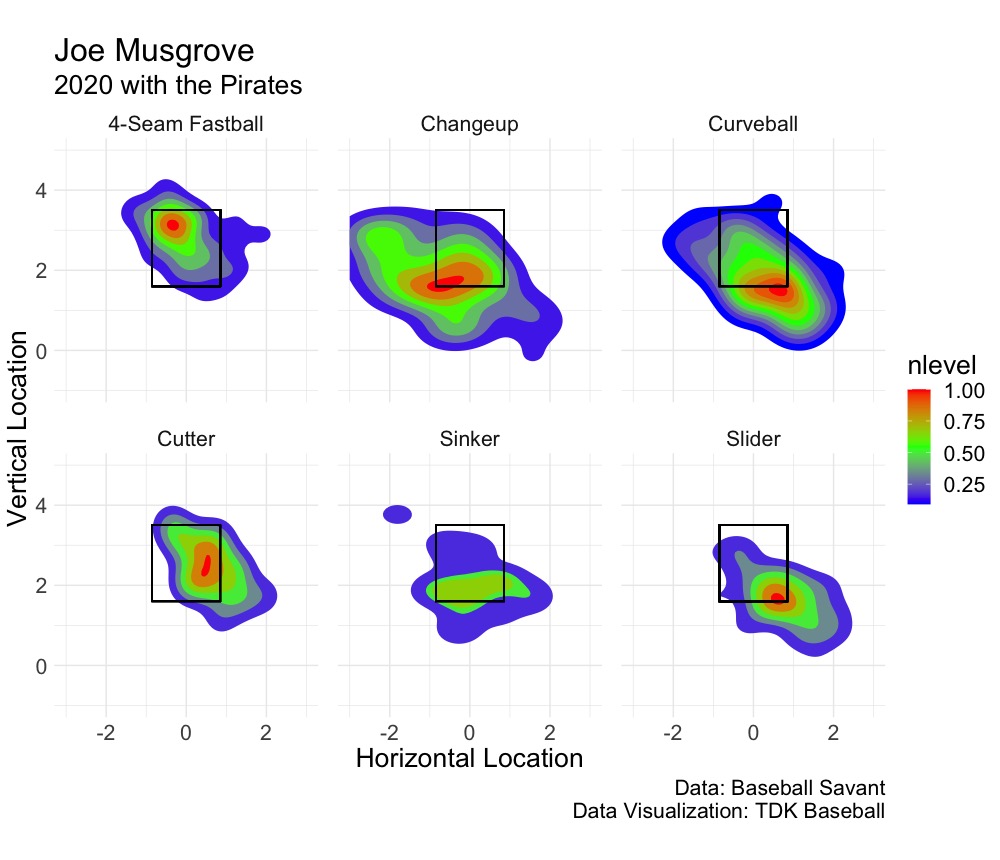
In 2020, however, Musgrove has been going up and attacking the top of the zone with the 4-seam and the curveball down in the zone; the modern pitching philosophy:
But the command, illustrated by the regions (small sample size of three starts and Pirates General Manager, Ben Cherington, did say they normally start evaluating [hitters] after 40 or 50 games). Sample size matters here, but Musgrove has started off walking 16.2 percent of batters and his 15 game rolling average of zone percentage (per FanGraphs) has fallen:

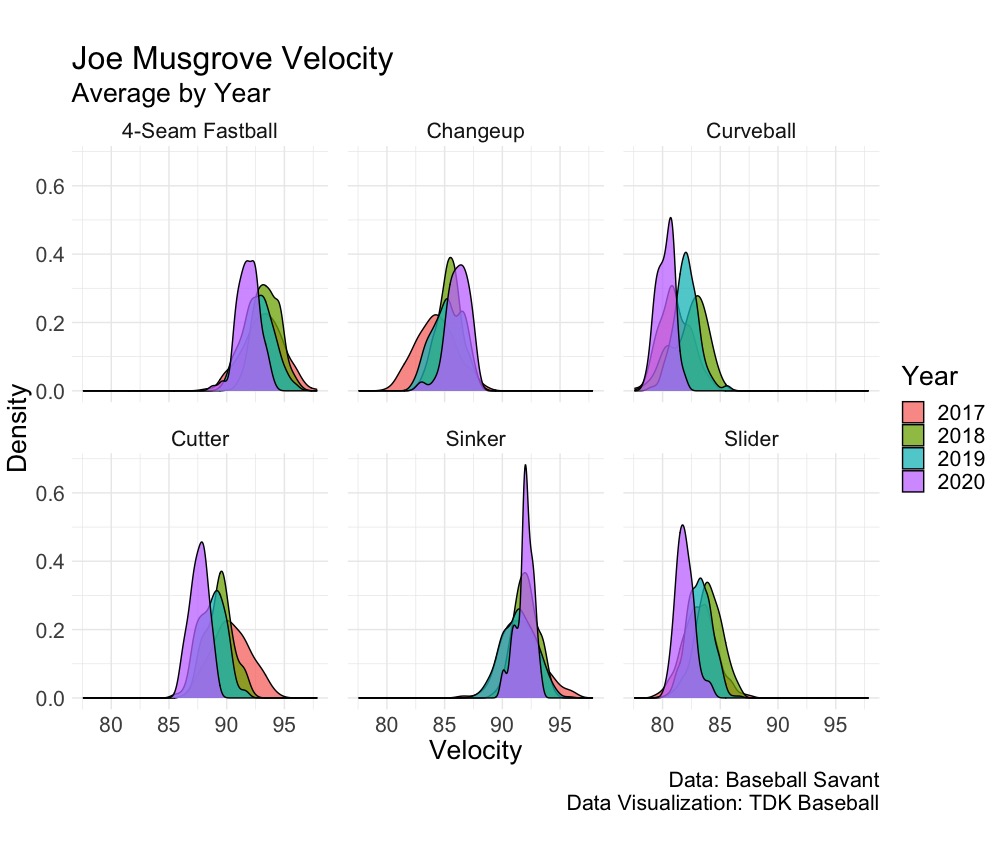
Musgrove had 60 command before so dropping off to levels that are more average would be fine if the stuff played, as the league average zone percentage was 41.9 percent last season for starting pitchers. But there is some concern on the stuff; while the fastball is spinning less (function of the loss in velo), the slider is spinning at 156 more RPMs, the curve is also up 105 RPMs, but it has come with a decrease in velocity:
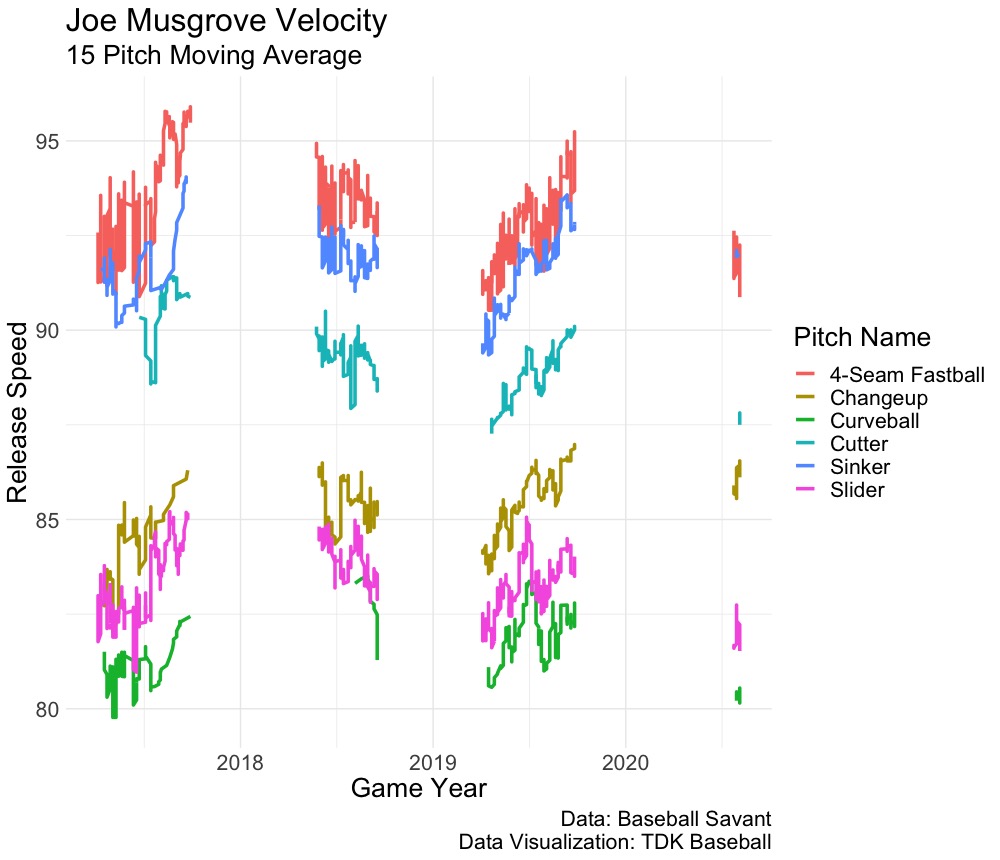
This happened with Musgrove last year, who has started off not throwing hard but ramped it up at the end of the season. This led to hope that Musgrove would build off that and have a healthy offseason and springboard him into a 2020 where he pitched to his indicators. Bob Walk did hypothesize on the post game show after Musgrove’s last start that the pitcher could be working with a dead arm following the shutdown and Summer Camp schedule. That could be the case, but there is still some concern given that the command has seem to fell from a 60 entering 2018 down to a guy with 50 command. That could be a product of his increase in other off-speed and given the walk rate he had in 2019, I’d be inclined to 55 the command given the decline in zone percentage and his missing of the glove so far in 2020.
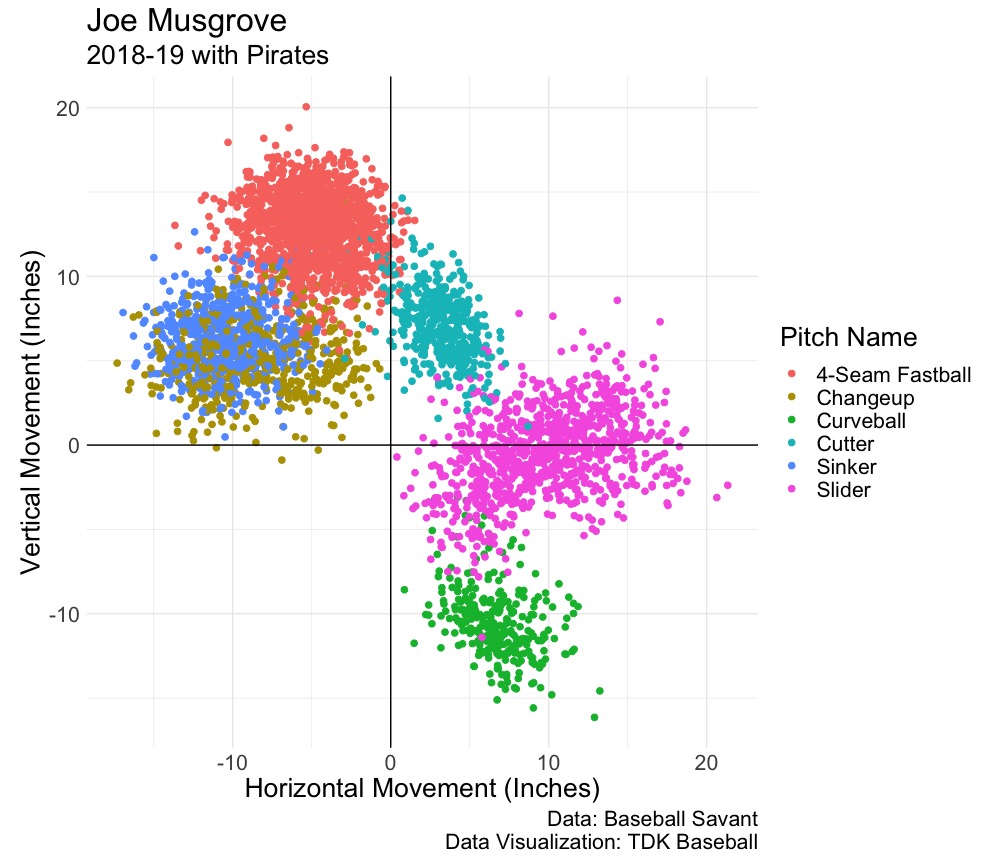
Looking at his pitch movement, the slider has some nice depth and glove side sweep to it, with it looking to backup at times. I think this could be a result of throwing the cutter often in 2018 and 2019. The sinker also backed up with less drop and less arm side run. The curveball had less glove side sweep and drop to it (from catcher’s point of view):

Examining with 2020, Musgrove seems to be more on par with his 2017 Astros stint in terms of pitch movement:
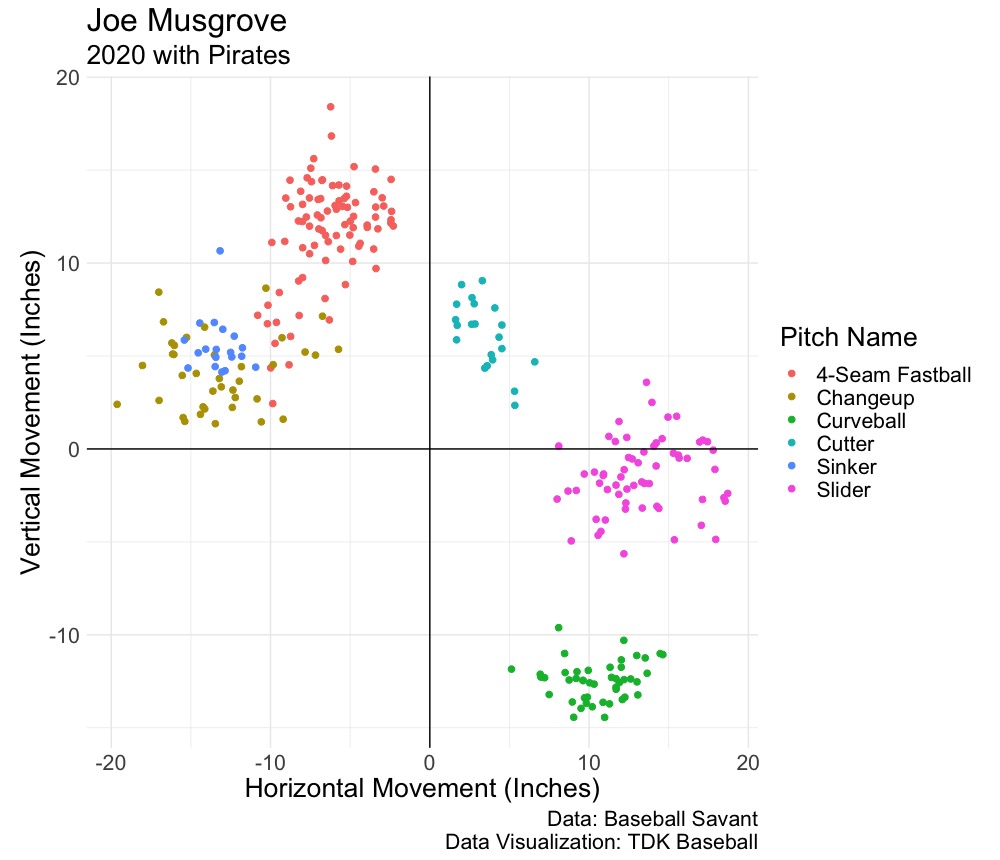
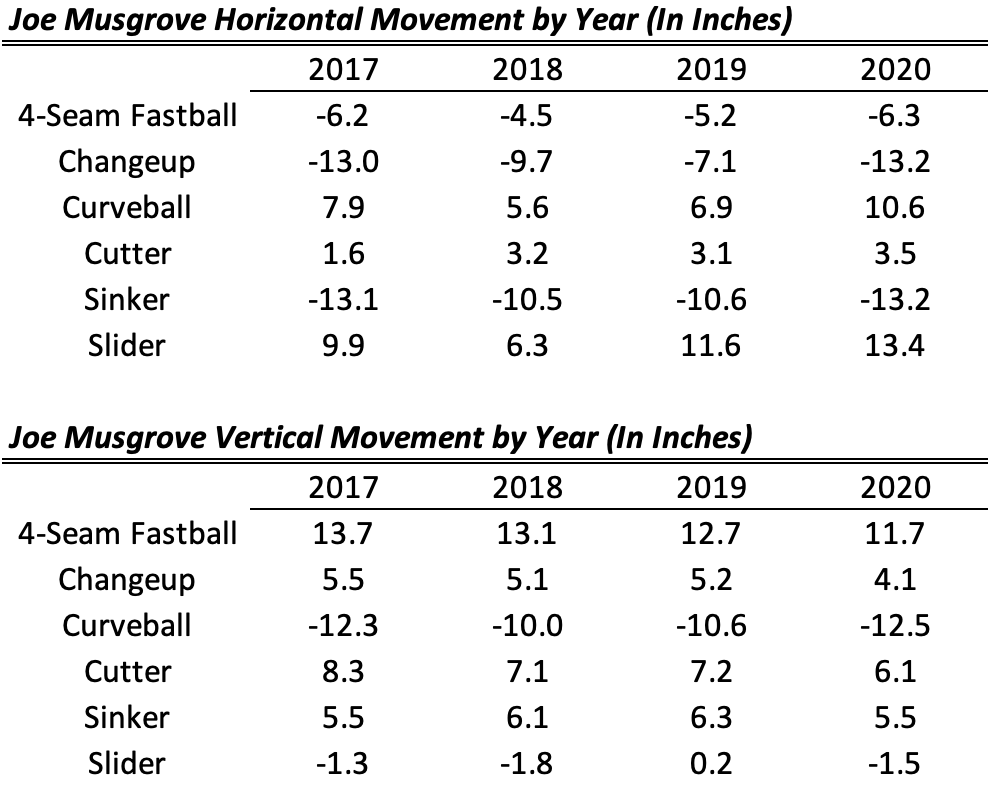
The fastball has gotten back to the same arm side run and more vertical drop, same with the changeup and sinker, while the curveball and slider have added more glove side sweep than before.
Scouting Musgrove
The 4-seam fastball is down from the 34th percentile in velocity and 81st percentile in spin to the 28th percentile in velocity and 60th percentile in spin. The pitch has average arm side run and drop. At 93-94, I think this pitch plays average but at 92 with the drop in spin, it’s graded a tick down. Present Grade: 45
The sinker has average arm side run and drop, but I do think it plays well against LHB (from 2017-2019, it produced a .356 xwOBA against LHB compared to the .403 for RHB against LHB). He’s been able to locate the pitch to the glove side, missing the barrel of bats. The command just hasn’t been there to get it down enough against right handers to make it an above average pitch against same side hitters, leaving it more up in the zone at times. It sits 91-92 mph and with the effectiveness against LHB, the pitch is a bit above average. Present Grade: 55

The changeup sits about 85-86 mph, showing just a 7 mph difference from the fastball. Follows a similar tunnel with the sinker given the similar vertical and horizontal movements. It has more arm side run to it in 2020, more at league average with better drop. Need a bigger sample to see if the changes stick, but similar to the sinker, I think it’s a pitch that plays better against left-handed batters than right-handed batters. It’s not a main offering and the decrease in velocity in the four-seamer makes me give it a half grade down. Present Grade: 45
The cutter has average horizontal and vertical movement to it while sitting at 87-88 mph. It’s an extra pitch that doesn’t generate much swing and miss to it and has similar spin to the slider, just thrown about 6 mph more in velocity. He hasn’t really commanded the pitch well and leaves it over the middle of the plate while potentially taking away from another pitch. Present Grade: 45
The slider has gained glove side sweep over the last two years and after being flatter and cutter like in 2019, the early results of 2020 show vertical drop that is comparable to 2017 and 2018. That’s above average movement in both directions though it has below average velocity to it. Before, the pitch had average spin but in 2020 through 62 sliders, it has shown above average spin at 2651 RPMs. The additional spin with the plus movement profile makes this pitch a really good weapon. Present Grade: 60
The curveball has also seen an increase in glove side sweep and a return level to the 2017 level of drop to the pitch. It’s now above average in spin rate (46 pitches this year) and has climbed from the 61st percentile in spin to the 71st percentile in spin. At times in 2017 he caught too much of the plate, but the command seems to better since then, being able to both bury it with two strikes to get a swing and miss but also throw it for a competitive strike. In early 2020, the pitch has missed below the zone. The profile is really good, but the inconsistent command (batters have an ISO of .198 since 2017 compared to the average of .154) knocks it down a grade. Present Grade: 55
Overall, Musgrove seems to be a B2 (50) starter; a backend starter who could fill a number four role in the rotation. So far in early 2020, the velocity is down but the movement on his pitches has changed to having a better profile on the breaking pitches. The fastball would be a 50 if the velocity comes back but the slider plays average against RHB and is an above average offering to LHB. The change and cutter are show me pitches, but I think ditching the cutter all together would be a better use of the repertoire. Given the inconsistency of his command, often times leaving a handful of pitches over the middle of the plate that get hit with authority, and the falling in-zone percentage, there is a lower B1 ceiling left for Musgrove if that’s cleaned up. A contending team could use him as a mid to backend starter or as a really quality swing man type (easily a B1 swing man with the stuff grading a half grade up and if he can get more on the FB without having to eat innings).
In concluding, it’s perhaps not too difficult to see why Musgrove has consistently underperformed his DRA. The four-seam fastball is average at best and is thrown over the middle of the plate. The breaking pitches have seen an increase in profile this year compared to previous years with the cutter damaging the slider. The sinker looks above average to LHB and average to RHB.
Looking at Baseball Savant and seeing the 68th percentile in exit velocity adds to the hit runs and out runs being above average, but the command of leaving the ball over the middle will lead to hitters being able to elevate the ball and hit at optimal positions. I think this is the biggest downfall, and while his pitches lead to limited walks, they are hung. Add in the falling zone percentage, and Musgrove not being able to catch his peripherals makes sense. He’s a league average starter who with more consistent command and seeing his velocity increase could reach that number three starter status.
0 Comments on “Analyzing Pitchers: Supplementing DRA with Statcast Data”