Evaluating Infield Defense: Data Visualization and Creating a Model

There are main stays for evaluating defense. FanGraphs provides the results for Ultimate Zone Rating (UZR) and Defensive Runs Saved (DRS), Baseball Prospectus has Fielding Runs Above Average (FRAA), and Baseball Savant has released Outs Above Average (OAA), using Statcast data. This post by Baseball Prospectus looks at which defensive metric is best, with OAA coming out on top with the infield. With the publicly available dataset on Savant, I wanted to create both my own model and how to visualize defensive range, using the software package R.
The data is first filtered to only include batted balls where data is available (years 2015-2019) and where the infield alignment is standard. Given that starting position of the fielder is unknown, using a standard alignment can best estimate the starting point of a fielder as it is the conventional defensive setup. Then, following along with Dr. Jim Albert’s hit model, the probability of a hit is calculated, though I also included a game year variable to control for the ball changes. The data is then filtered down again to only look at ground balls. The rest of this article will break down infield defense from left to right (third base to first base).
***
Third Base Defense
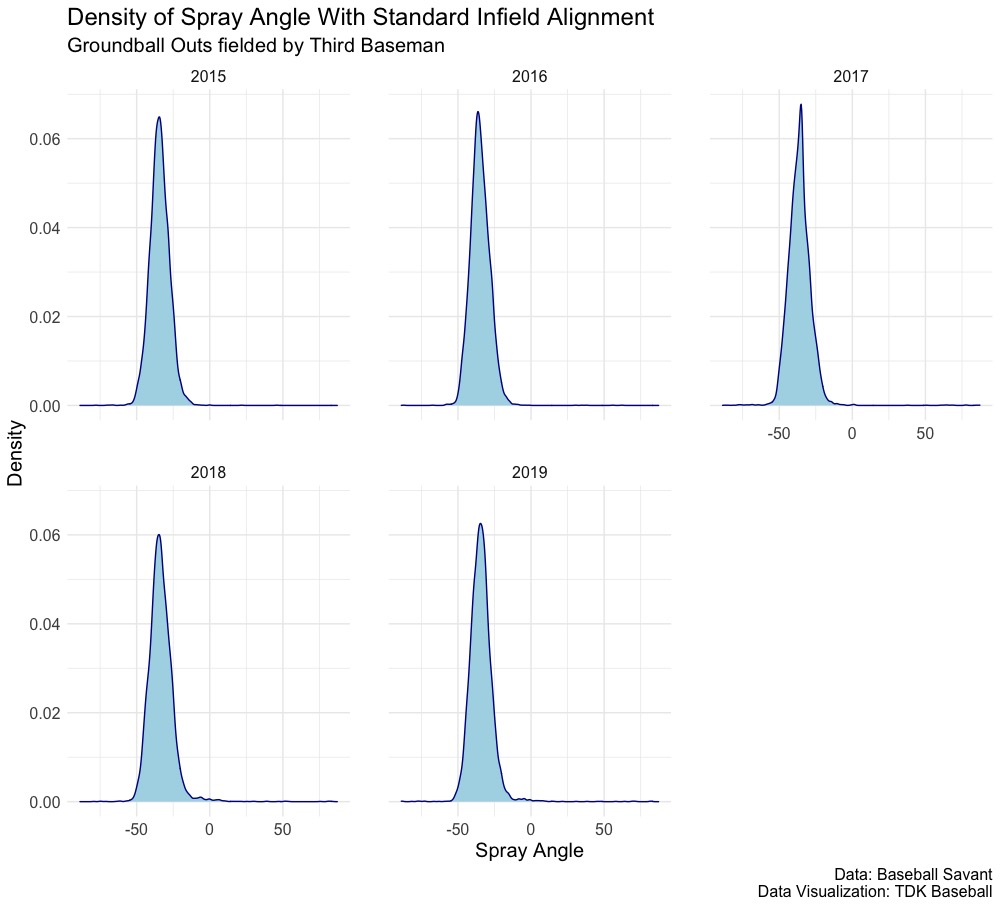
We first want to look at the distribution of balls within the spray angle (note: actual spray angle and not adjusted) to determine the groundballs within a fielder’s zone. Looking at balls that are outs, as a best way to view a typical field range, we get the following density plots:
Since we don’t have starting position, I wanted to look at the balls a third baseman has a fairly real chance at, subjectively deciding 90 percent of the balls. The left bound is then the 5th percentile and the right bound the 95th percentile in spray angle, cutting 5 percent off from a fielder moving to their right and left. This leaves us with the following over the last five years:
| Left Bound | Right Bound |
|---|---|
| -45.6º | -23.3º |
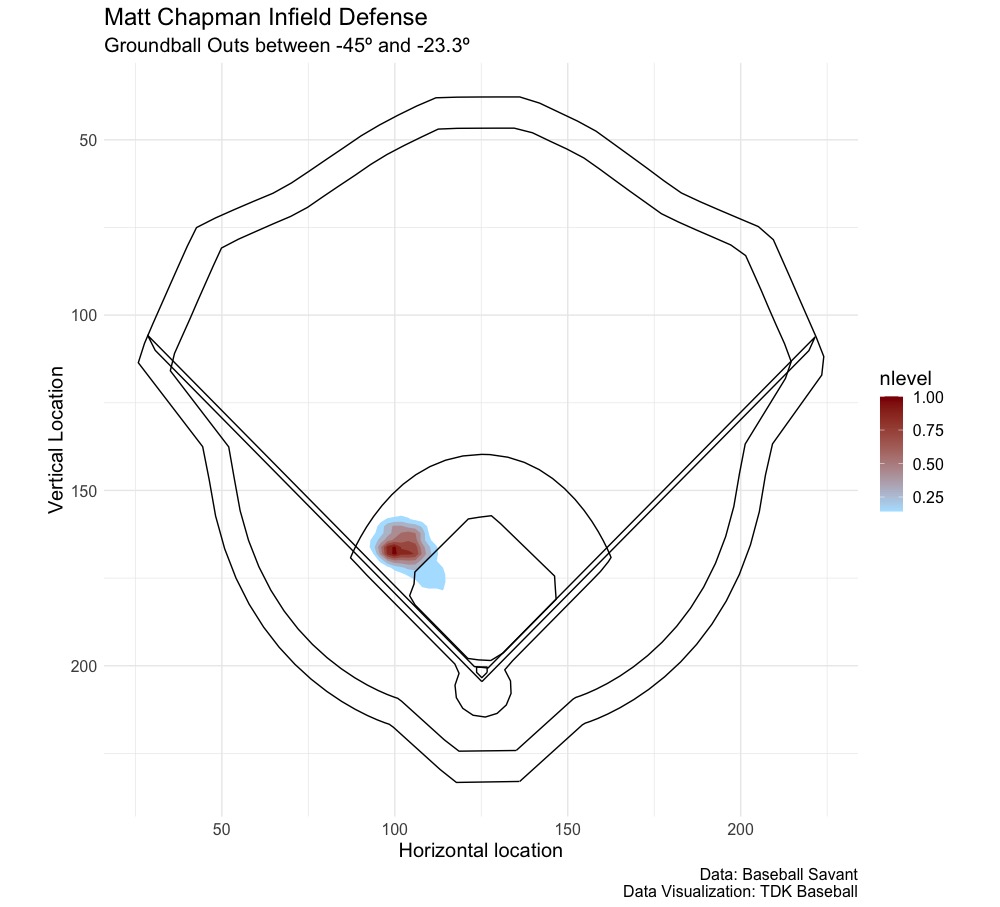
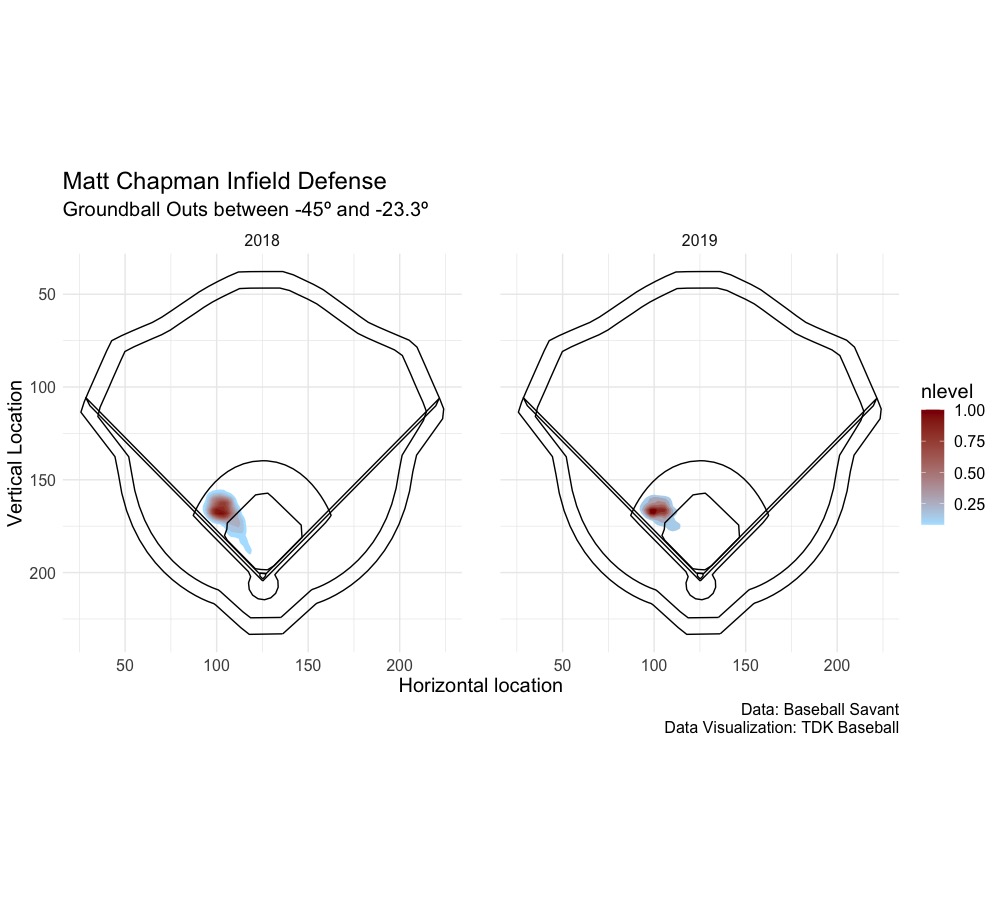
But hold on, -45.6º is outside the playing field and being in foul territory. There can be two reasons, balls can be fielded on that side of the bag, à la this Manny Machado play, or an error in tracking. The fielder’s left bound will be -45º as that is the foul line and their right bound will be -23.3º. This can help for evaluating infielder range, with the Oakland Athletics’ Matt Chapman illustrated below (as a prospect was a 55 present and 60 future per FanGraphs), using the GeomMLBStadium package to overlay onto the RingCentral Coliseum, since 2018:
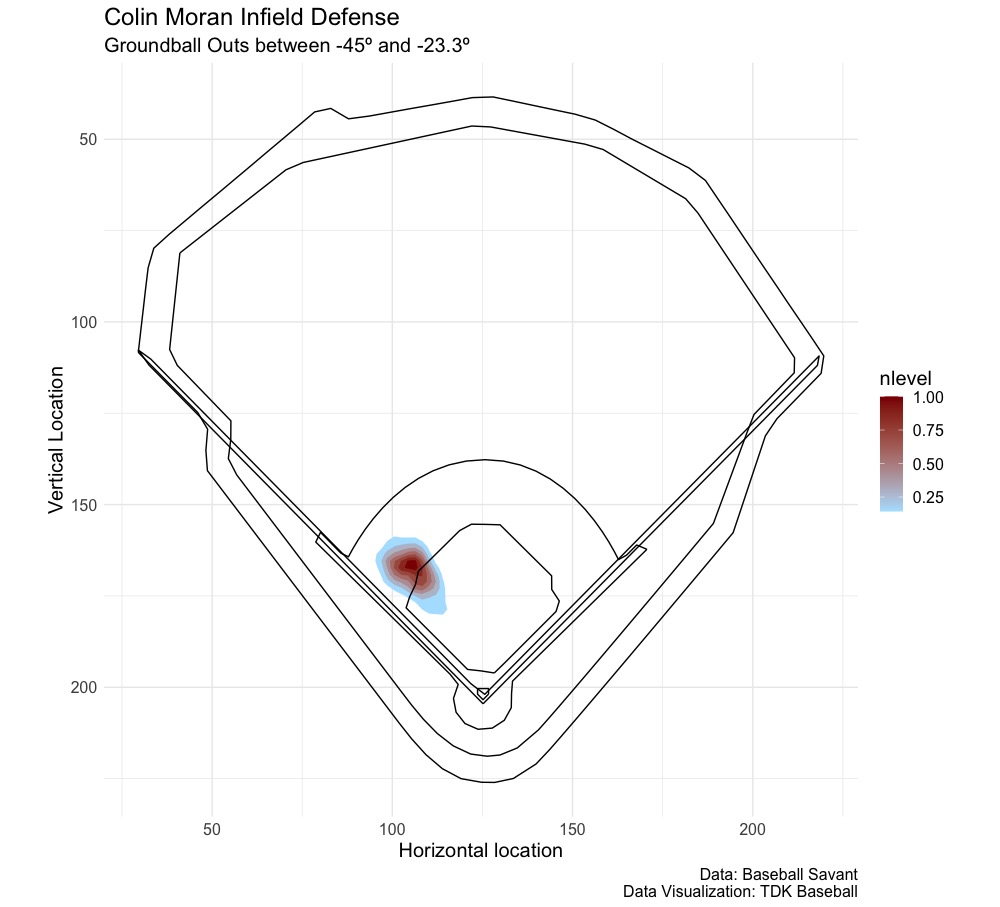
What we can see is that Chapman has a denser area towards the foul line, indicating that he is crossover and get to those balls over at the foul line. His spread is also towards the left, given the red area more towards the shortstop. The best estimate to starting position is where the density is highest (the darker the red). Let’s contrast this with Colin Moran, who is not known for his defense (a 45 present and 50 as a prospect in 2018), and this time overlaid on to PNC Park:
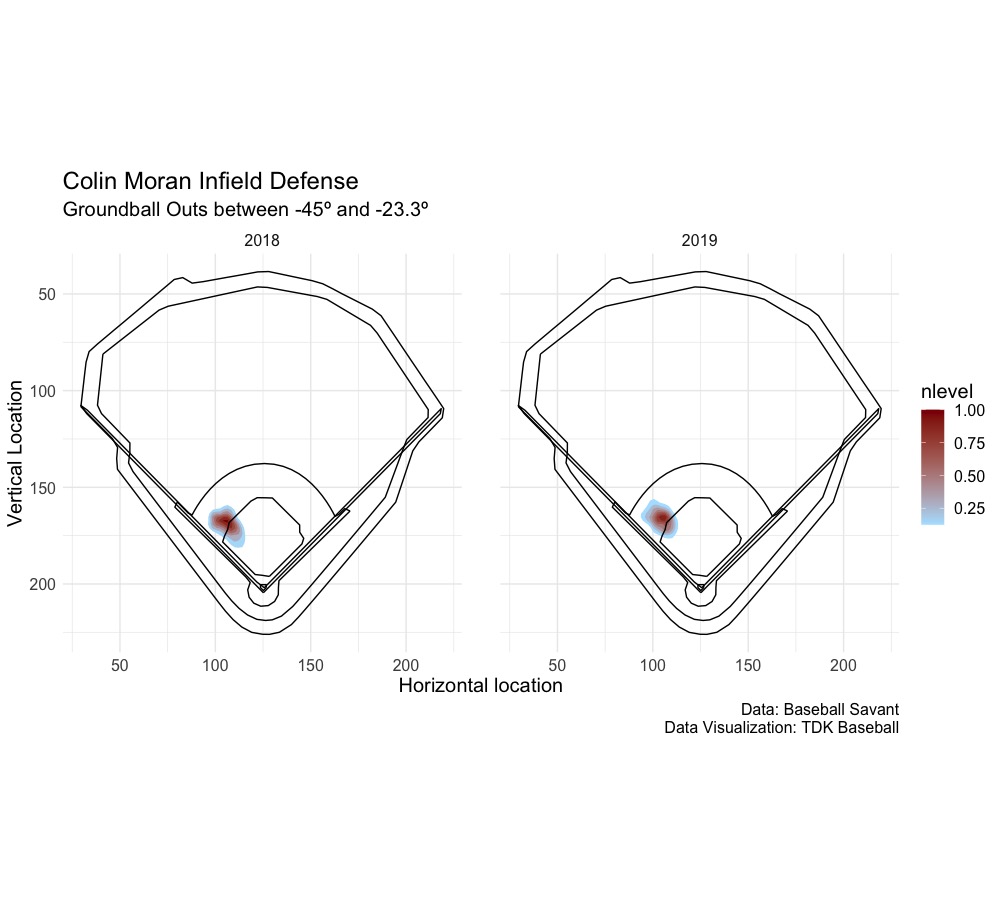
Notice how Moran has less dense of an area towards the foul line and isn’t able to come in on the ball (chopper, bunt, etc.) with the same ability as Chapman can. Looking at where the hits and outs line up on a neutral field, we get this comparison:
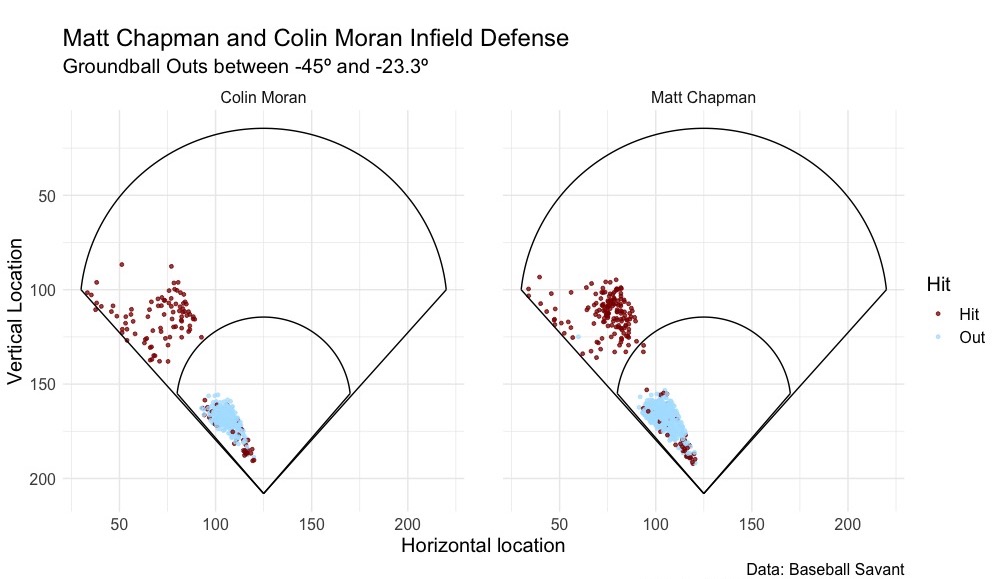
I’ve included the balls hit to the left fielder to help illustrate the fielder’s range and the bounds. For Chapman, there are less balls down the line compared to Moran but there are more balls to gap between the shortstop and third base. I believe this helps illustrate the bounds of the defense, but for looking at a player’s range, the heat maps of outs are a better visualization. How does this add up to Baseball Savant’s OAA, which provides directional breakdown? Looking at Moran and Chapman for 2018 and 2019 we see:
| Total | In | To Right | To Left | Back | |
|---|---|---|---|---|---|
| Chapman | 22 | 10 | 2 | 9 | 1 |
| Moran | -16 | -2 | -12 | -1 | -1 |
No surprise given the heat maps, but Chapman all around has better range than Moran, going both to the left and to the right. Creating a model then we need the chances, hits saved (HS), hits saved per chance (HSPC), and their corresponding league numbers to create a hits saved per chance above average (HSPCAA). This follows roughly the UZR model, where if the batted ball is an out, the fielder gets 1-hit probability, but if the batted ball is a hit, the fielder gets 0-hit probability, controlling for game year. Here are the top five third baseman (min 100 chances) and their rank in the other metrics (if they don’t have 100 chances in my model, they are not included):
| HSPCAA | Rank | OAA Rank | DRS Rank | UZR Rank | |
|---|---|---|---|---|---|
| David Bote | 0.098 | 1 | 12 | 19 | 26 |
| David Fletcher | 0.073 | 2 | 5 | 7 | 4 |
| Alex Bregman | 0.066 | 3 | 8 | 4 | 13 |
| Yoan Moncada | 0.056 | 4 | 7 | 22 | 5 |
| Nolan Arenado | 0.044 | 5 | 1 | 2 | 2 |
Shortstop Defense
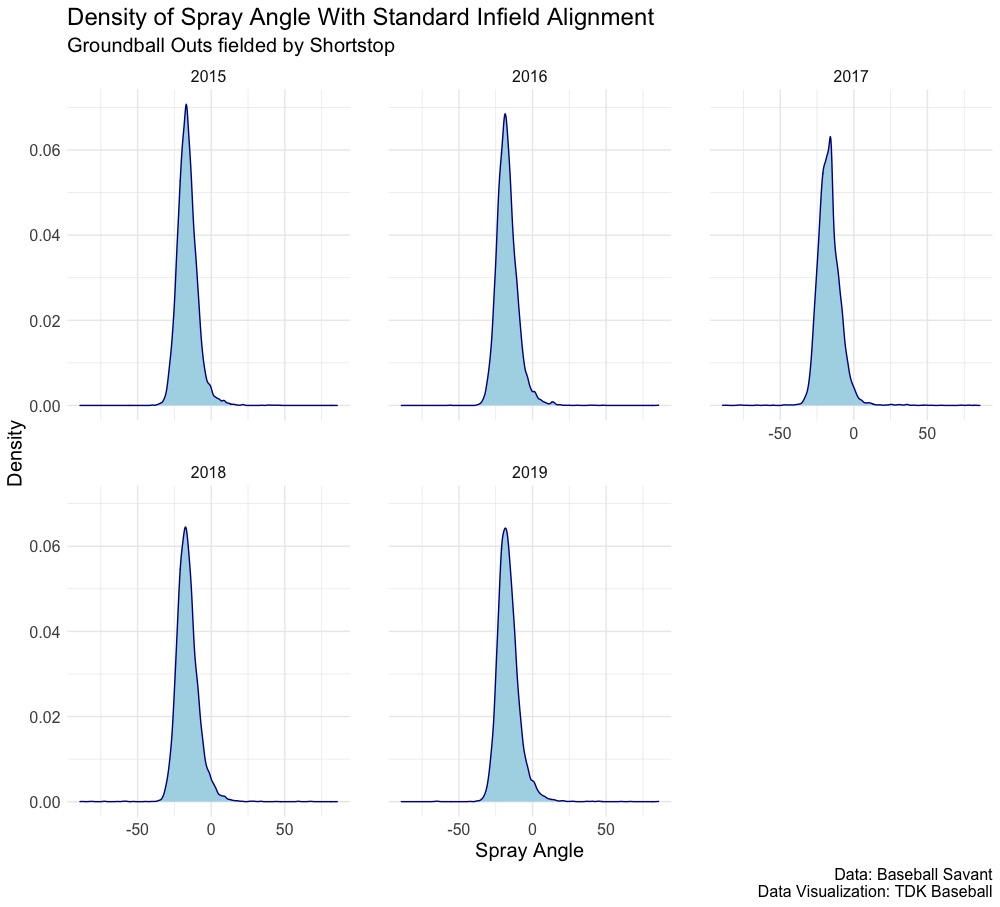
The process about the model is the same, so this will focus on the data visualization parts and deciding the zones defined by spray angle. For shortstop, we see:
The shortstop has more area to cover, and as a result here is their right and left bounds:
| Left Bound | Right Bound |
|---|---|
| -26.7º | -4.2º |
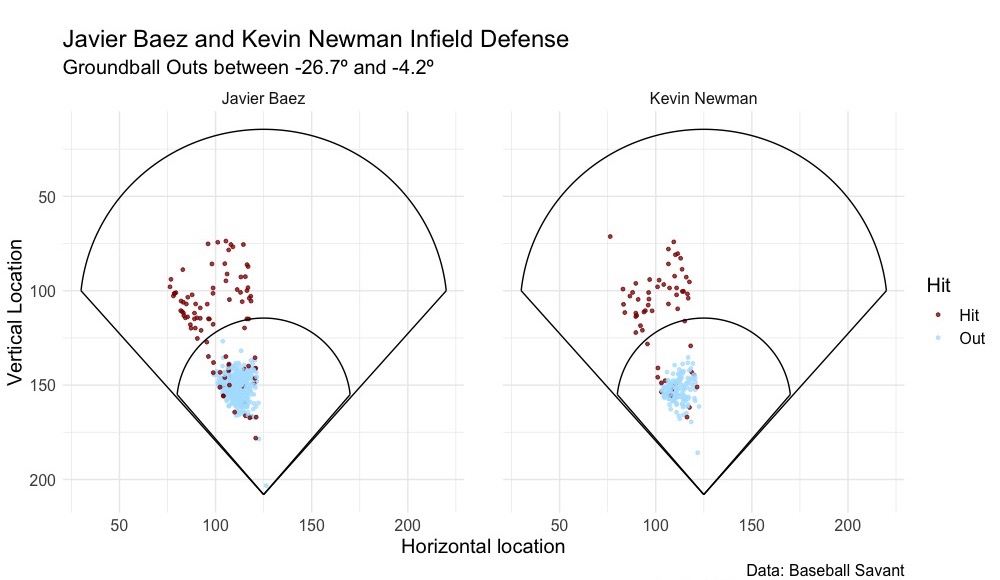
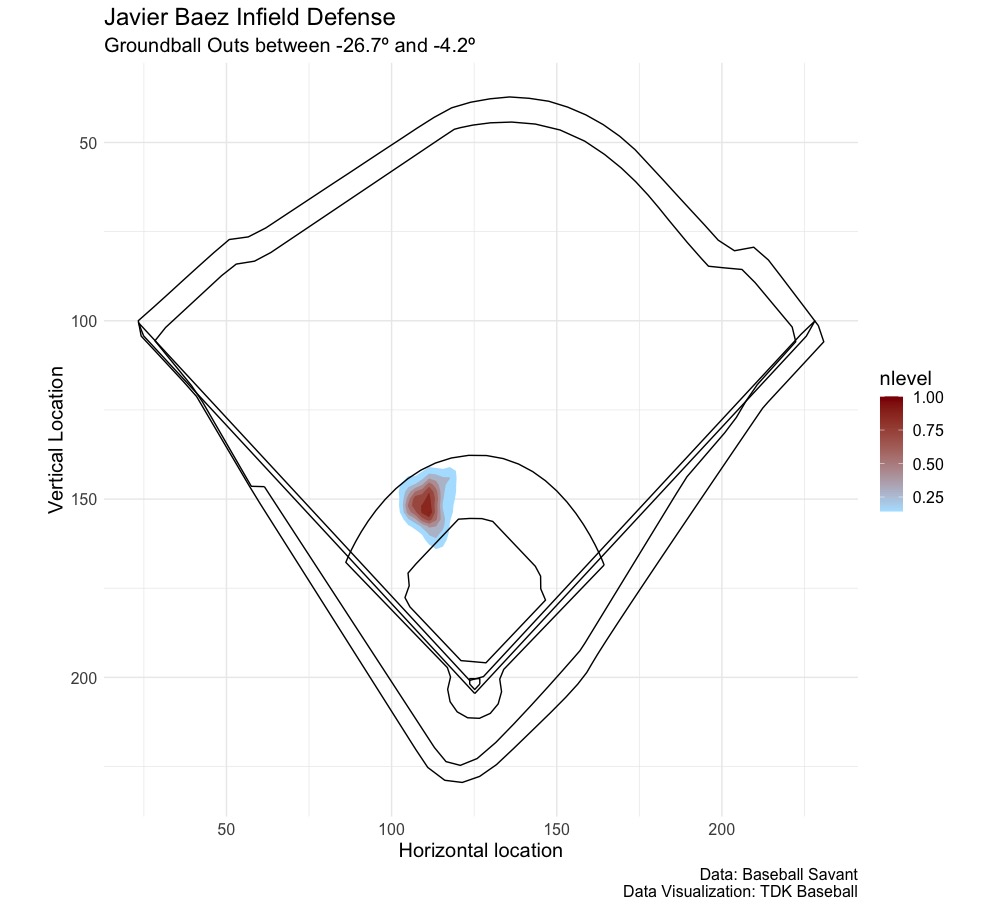
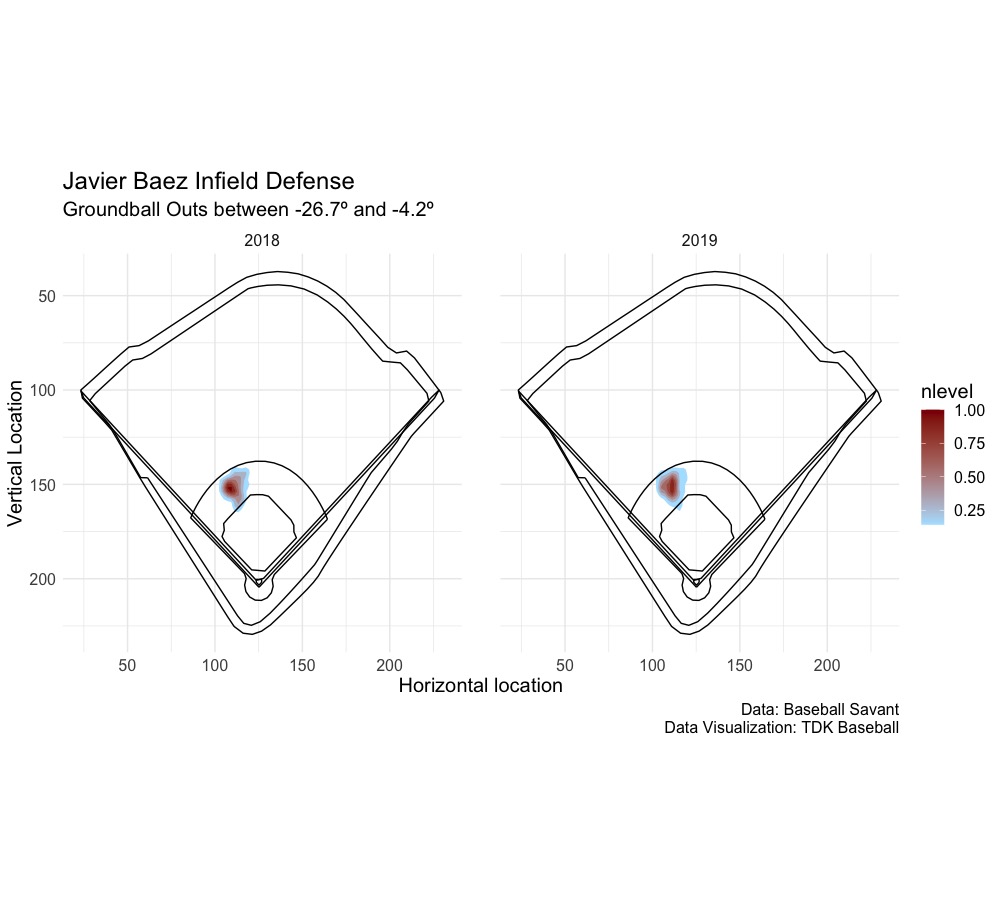
The shortstops range covers from about the end point of the third baseman, with some overlap, to balls hit up the middle but still on the left side of the mound (catcher’s point of view). Looking at Javier Baez of the Cubs, we get the following charts:
Baez is considered an elite level defender, as he led the position in OAA last year, and Jason Parks, now the Director of Professional Scouting for the Arizona Diamondbacks, put a 6 on the glove when Baez was a prospect. Let’s contrast that with Kevin Newman, who was a present 40 and future 45 glove by FanGraphs in 2019, and struggled going to his right last year with -6 OAA (note because of the lack of playing time in 2018, Newman’s 2019 is shown):
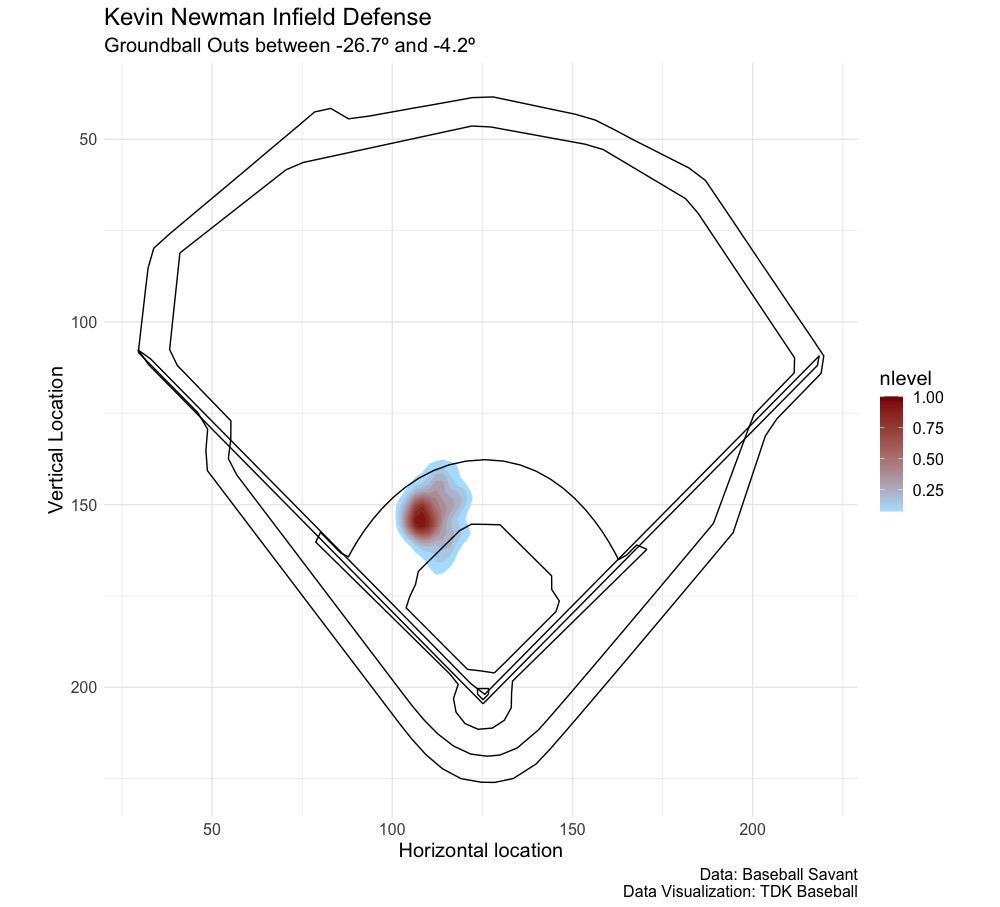
Newman has a dense spot (dark red) at about where a player would line up normally and he can go to his left a bit (1 OAA) but it’s not as dense. Newman’s range isn’t as good as Baez’s. Newman had -0.097 HSPCAA (ranking 30th of 31 shortstops with 100 chances), though Baez was only a bit above at 0.010 (ranking 17th)
The top 5 are:
| HSPCAA | Rank | OAA Rank | DRS Rank | UZR Rank | |
|---|---|---|---|---|---|
| Corey Seager | 0.076 | 1 | 9 | 12 | 21 |
| Miguel Rojas | 0.075 | 2 | 9 | 12 | 6 |
| Willy Adames | 0.074 | 3 | 12 | 5 | 12 |
| Orlando Arcia | 0.062 | 4 | 21 | 12 | 18 |
| Jonathan Villar | 0.550 | 5 | 21 | 19 | 20 |
Second Base Defense
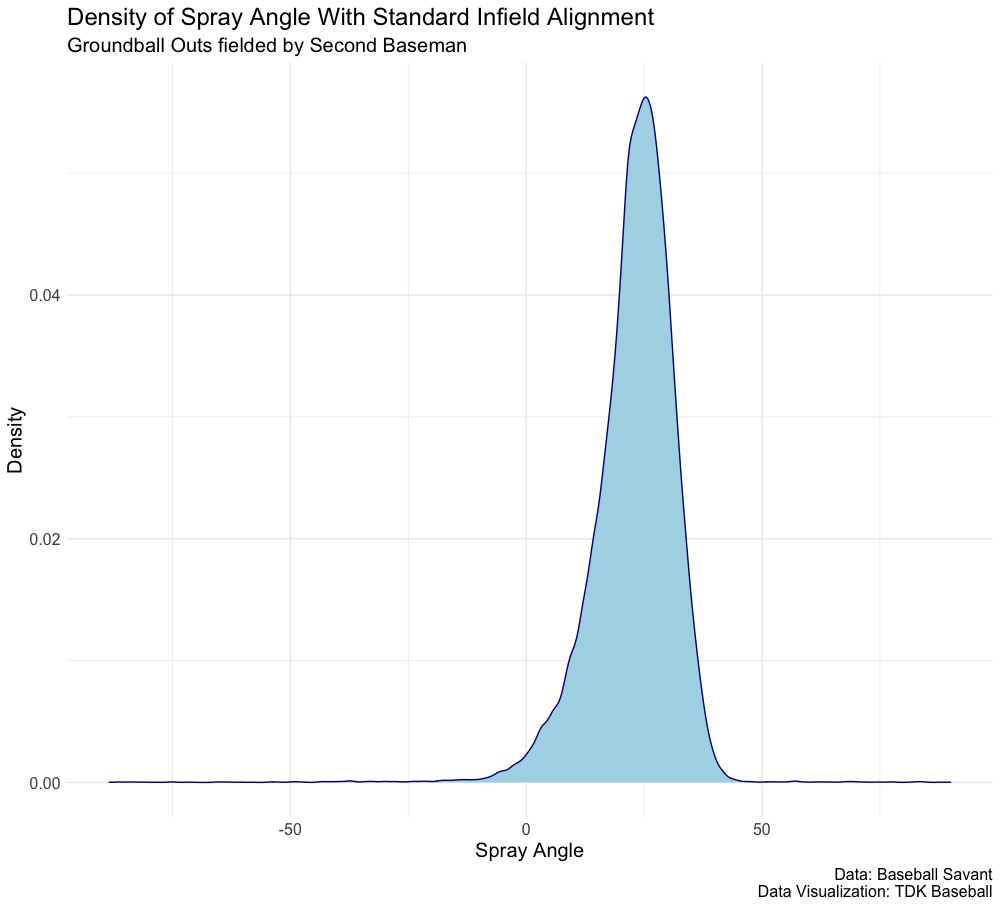
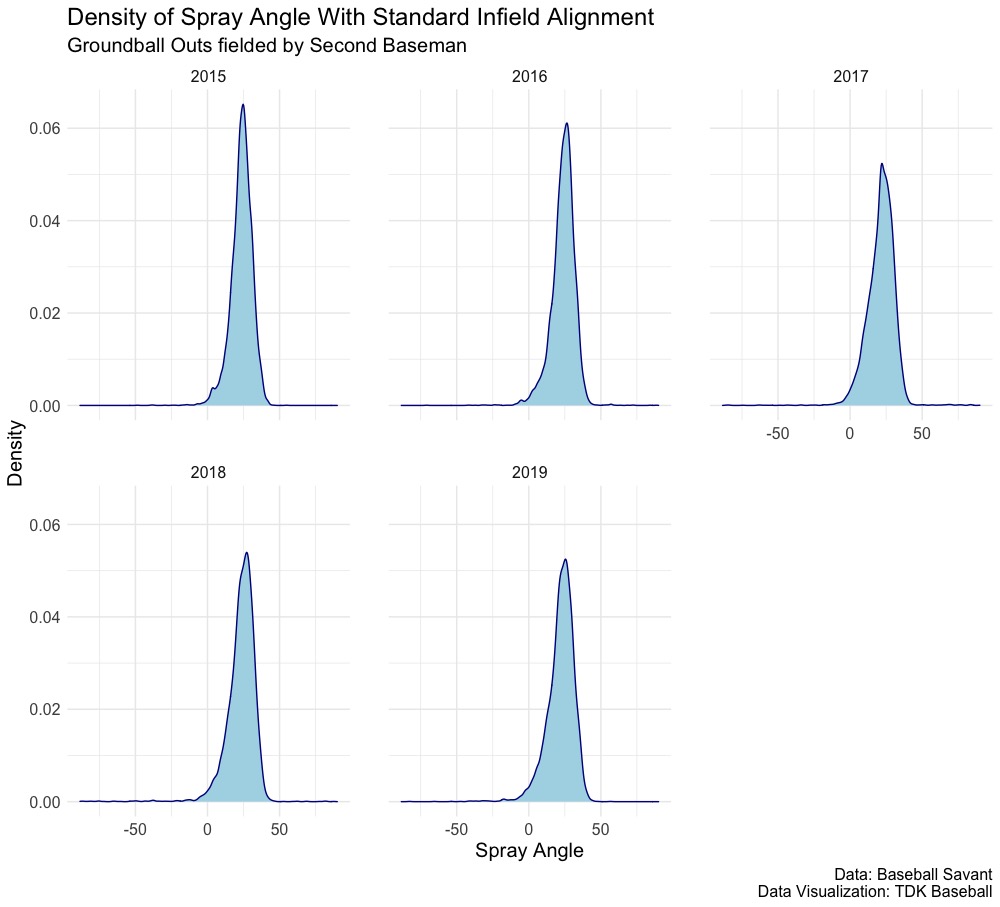
The spray angle for the second base defense are below:
The bounds for going to the right and left are:
| Left Bound | Right Bound |
|---|---|
| 7.6º | 34.4º |
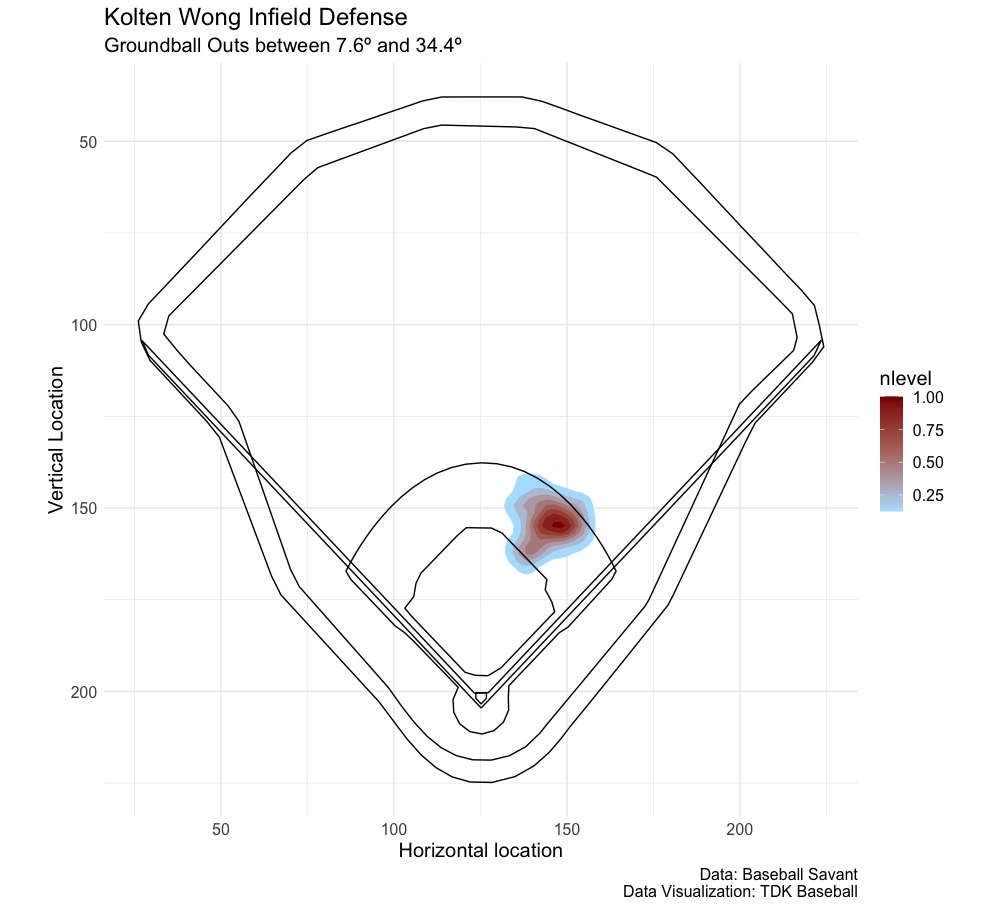
Second baseman have less range than shortstops going to their right, making their left bound at 7.6º not surprising when the shortstop’s absolute value to their right is -4.2º. However, they do have to cover a bit more ground given a first baseman can’t go to their left very far in order to have somebody at the bag. Darwin Barney is the most likely to have the most range of second baseman, being a topflight defender and while this data goes back to 2015, Barney last saw a huge chunk of playing time at second in 2013. Kolton Wong of the St. Louis Cardinals comes to mind as a rangy and plus second baseman, with Parks giving the glove a 6.
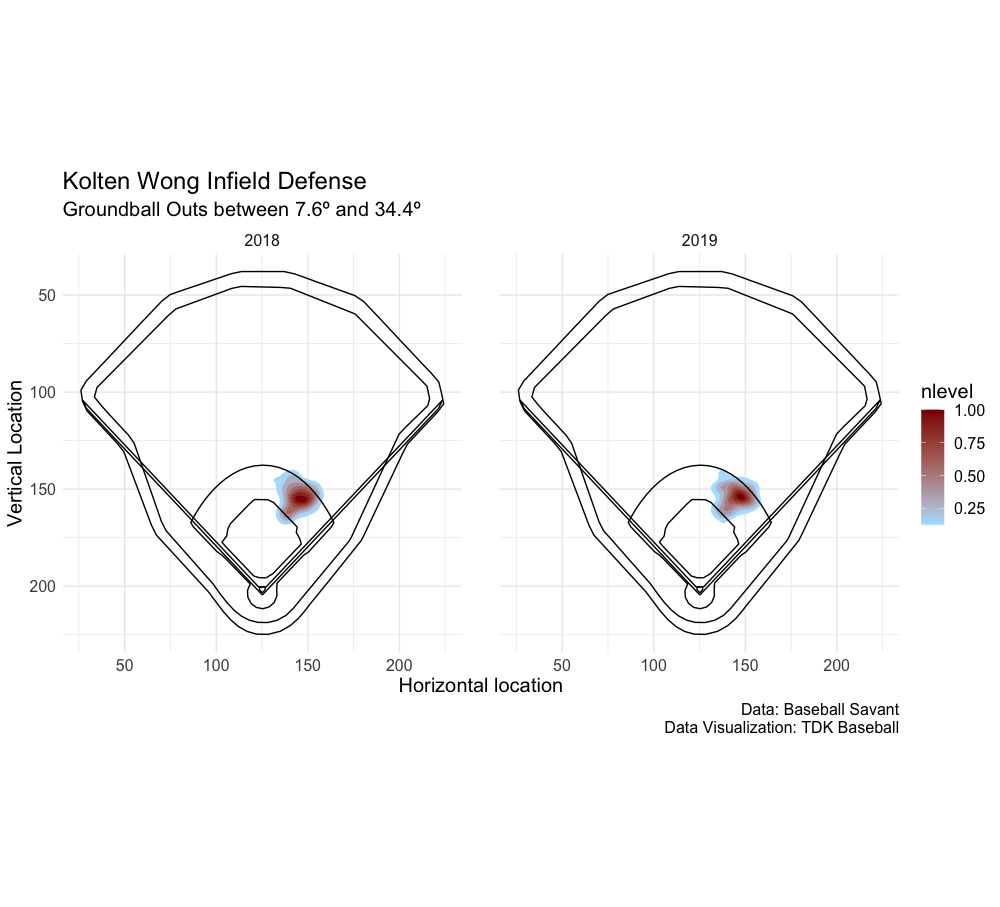
Wong ranks third in OAA going to his right (3 OAA) and fourth going left (6 OAA), and as seen in the heat map, Wong has a dense area more to the right side of the infield (from catcher’s view) and is able to range left to cover the ground that the first baseman can’t.
On the flip side, Keston Hiura was given a present 45 and future 50 by FanGraphs last offseason, but his defense does appear to seem worse; he posted -7 OAA, -5 DRS, -8.2 UZR, and -4.9 FRAA:
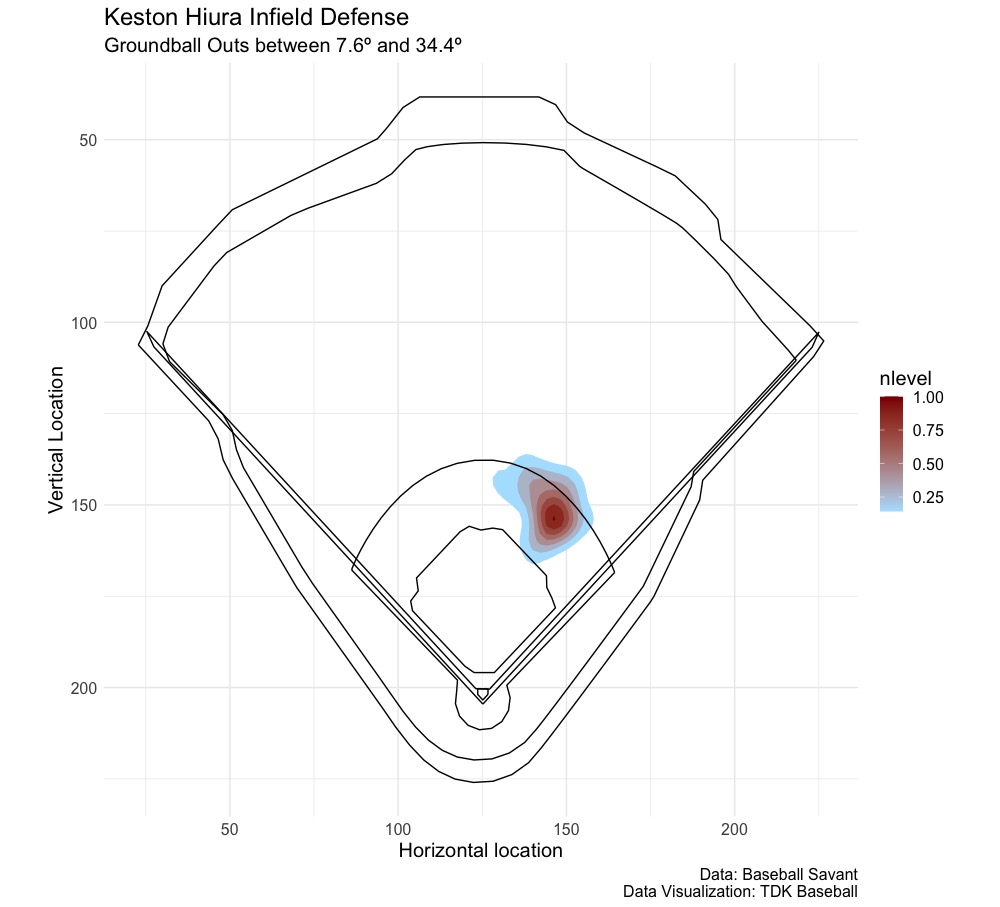
Hiura, a rookie last season, was able to get to some balls to his left, but it’s not as red as Wong’s was. Hiura also struggled to go in, especially compared to Wong:
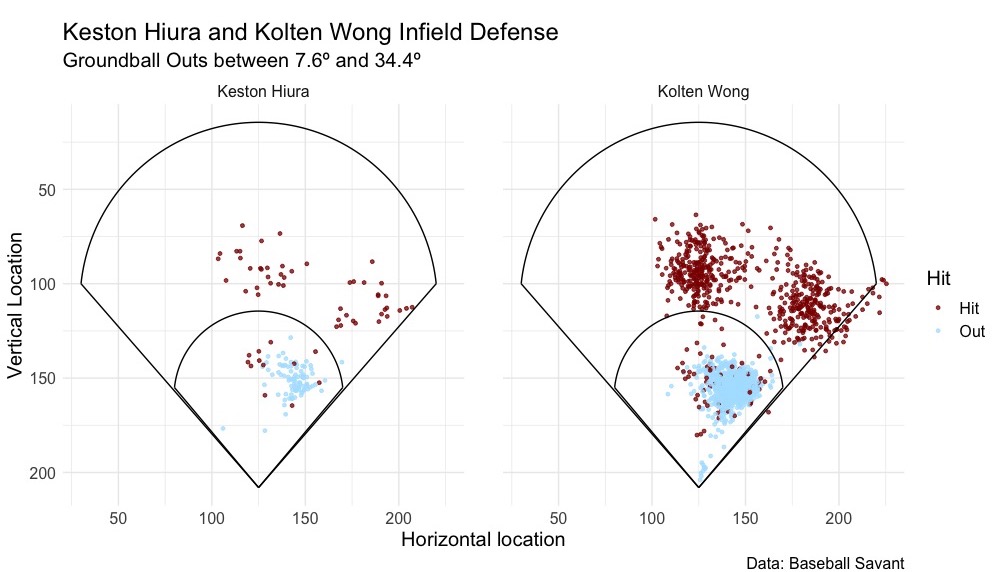
Using the Statcast OAA leaderboard, we see for these two players since 2018:
| Total | In | To Right | To Left | Back | |
|---|---|---|---|---|---|
| Wong | 21 | 0 | 8 | 8 | 6 |
| Hiura | 7 | -4 | -5 | 0 | 1 |
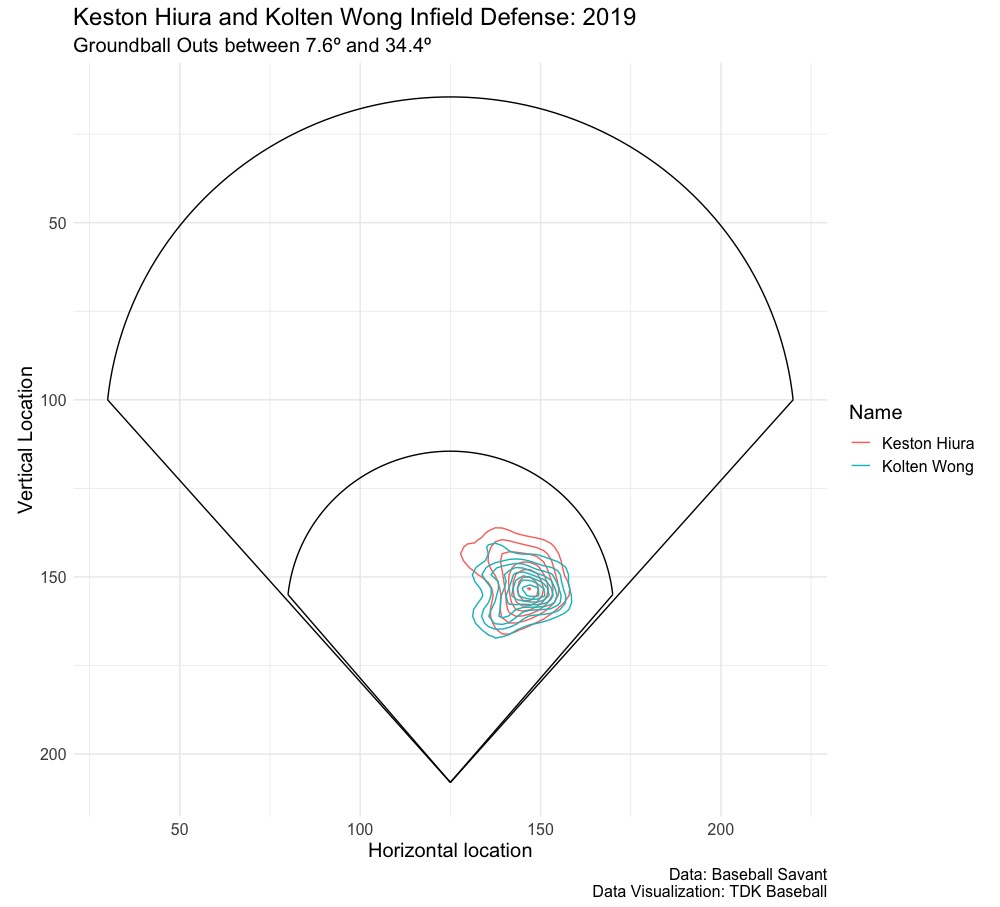
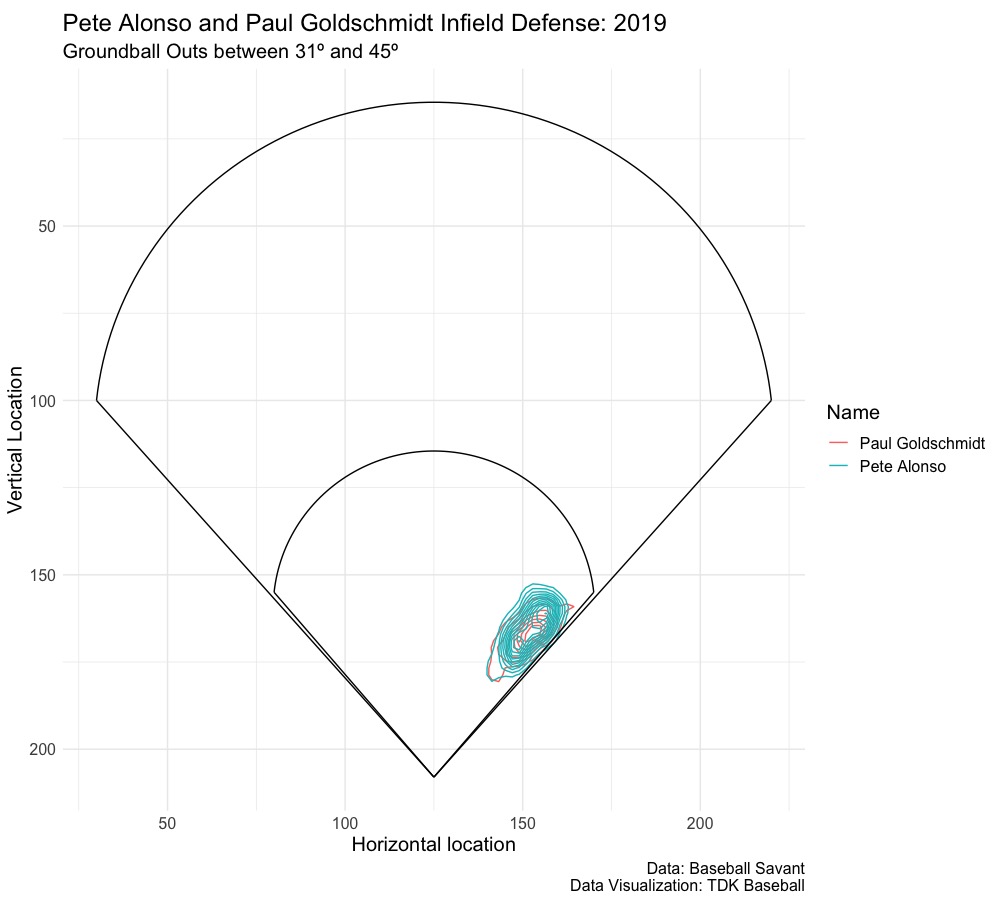
Another way, instead of looking at just two separate heat maps and a spray chart is overlaying two contour maps or heat maps:
We don’t have starting position, making it a more difficult estimate of range, as Wong looks to be worse than going to his right than Hiura, despite the OAA measurement. But we can see Wong has the better ability to come in and has more of a region to his left (catcher’s right). Adding a starting point variable would only make this better. The top five (among 36 with 100+ chances) and their ranking among the other metrics:
| HSPCAA | Rank | OAA Rank | DRS Rank | UZR Rank | |
|---|---|---|---|---|---|
| Addison Russell | 0.123 | 1 | 5 | 12 | 6 |
| DJ LeMahieu | 0.112 | 2 | 12 | 6 | 3 |
| Brock Holt | 0.071 | 3 | 7 | 6 | 9 |
| Jose Altuve | 0.054 | 4 | 21 | 15 | 35 |
| Kolten Wong | 0.054 | 5 | 2 | 1 | 1 |
First Base Defense
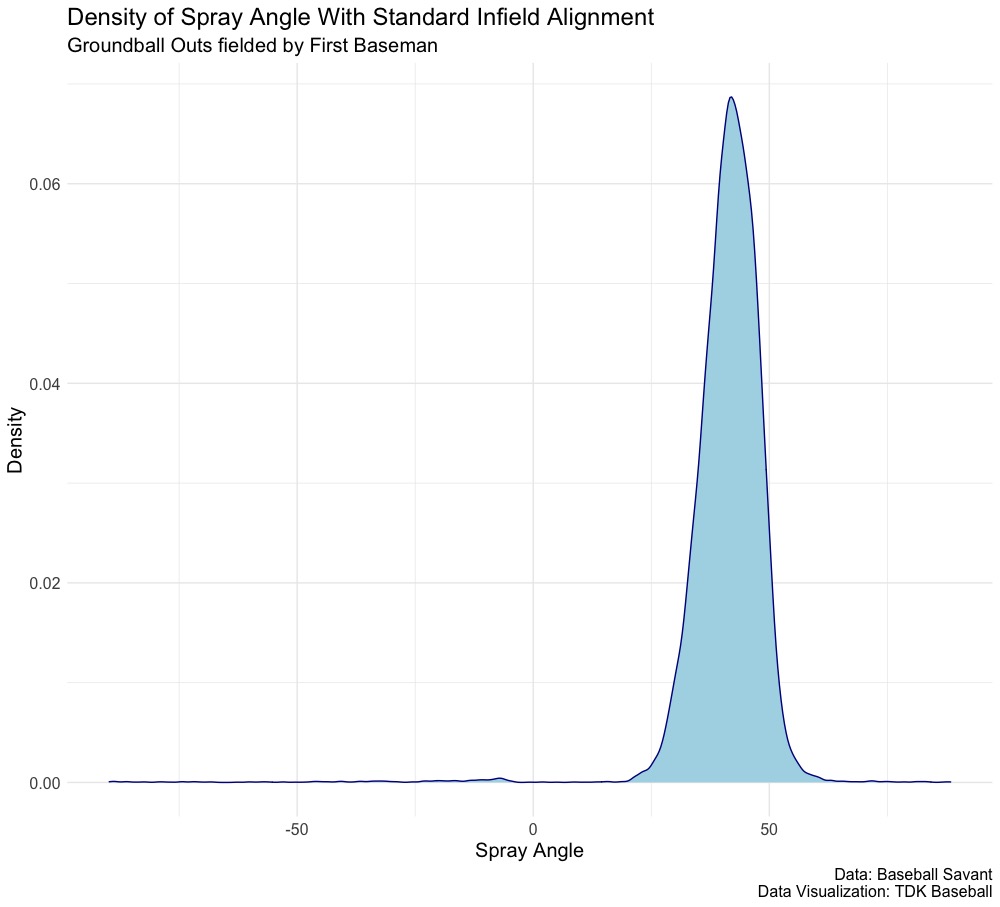
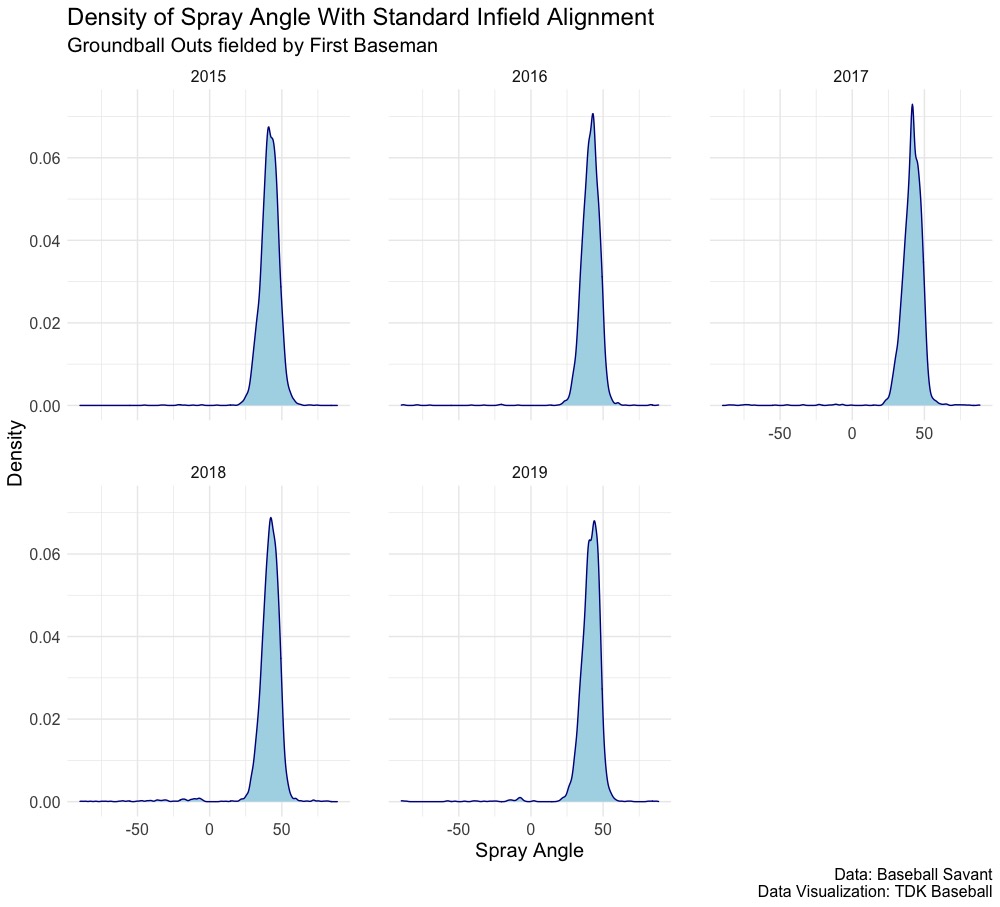
Finally, we get these spray angles for the first base groundballs:
With these following bounds:
| Left Bound | Right Bound |
|---|---|
| 31º | 50.3º |
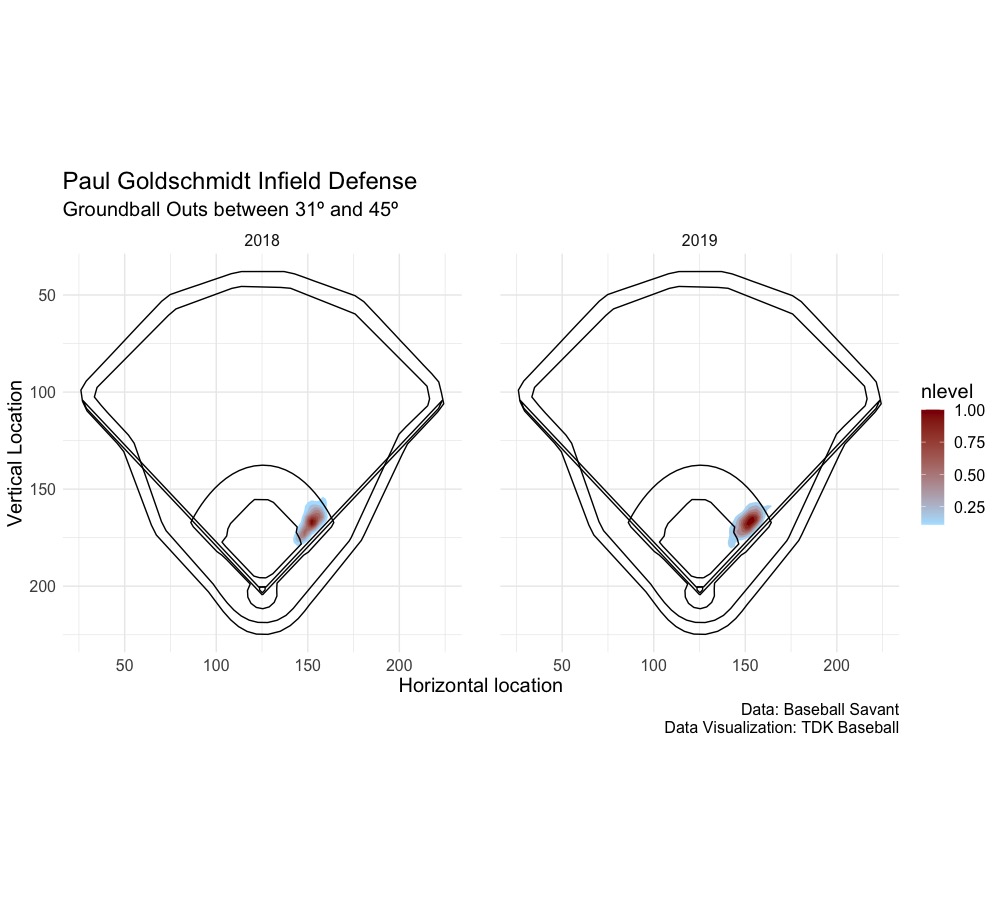
The same problem as with third baseman occurs, so the right bound will be changed to 45º, but note that the left bound does not overlap with the second baseman’s right bound. Also note that range for first baseman is less important, as they can’t move too far off the bag and to their right. Paul Goldschmidt is considered a plus defender, and has that pedigree. When Goldschmidt was prospect in 2011, Kevin Goldstein, hired at the end of 2012 by the Houston Astros as Pro Scouting Coordinator and is now a Special Assistant to General Manager James Click, wrote for Baseball Prospectus, “He has good hands at first base and saved plenty of infield errors by picking out throws in the dirt.”
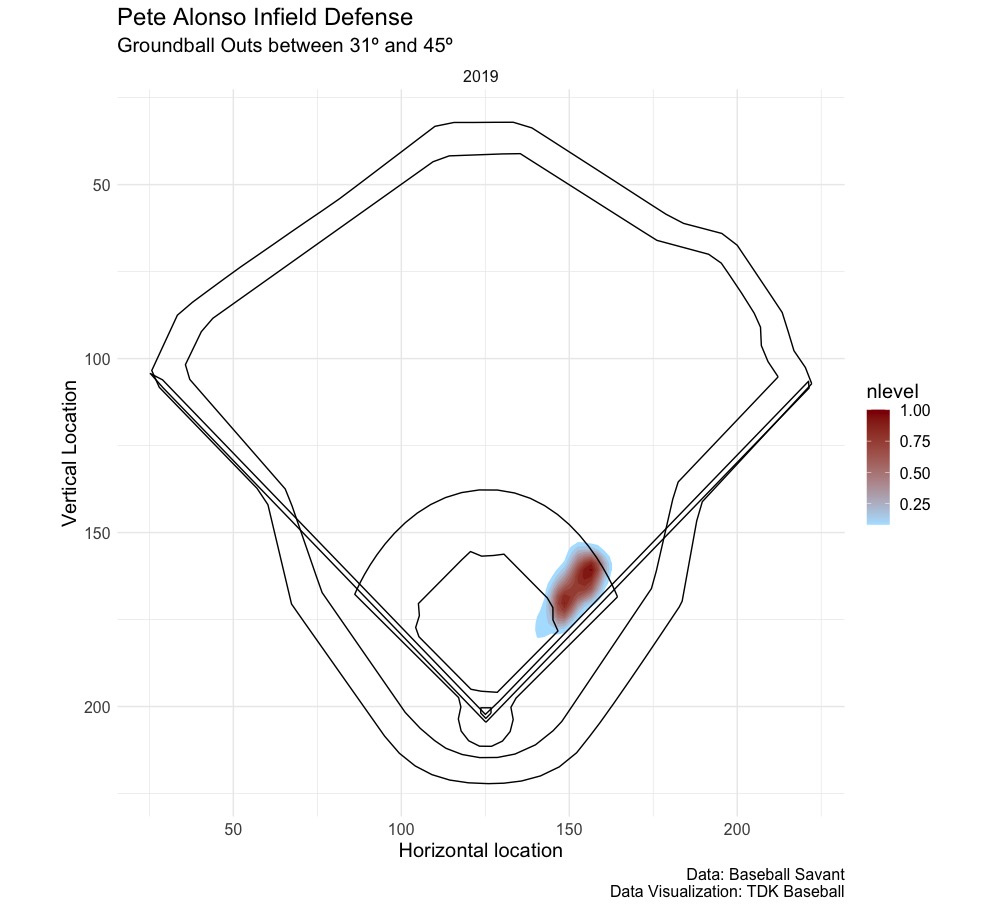
Goldschmidt is able to go back on the ball and in on the ball with good, soft hands. The range matters less, as there are bounds to going to their left with the foul line and an arbitrary bound to their right as they need to get back to the bag. A first baseman considered subpar is Pete Alonso, who had 40 present and future grades by FanGraphs last season:
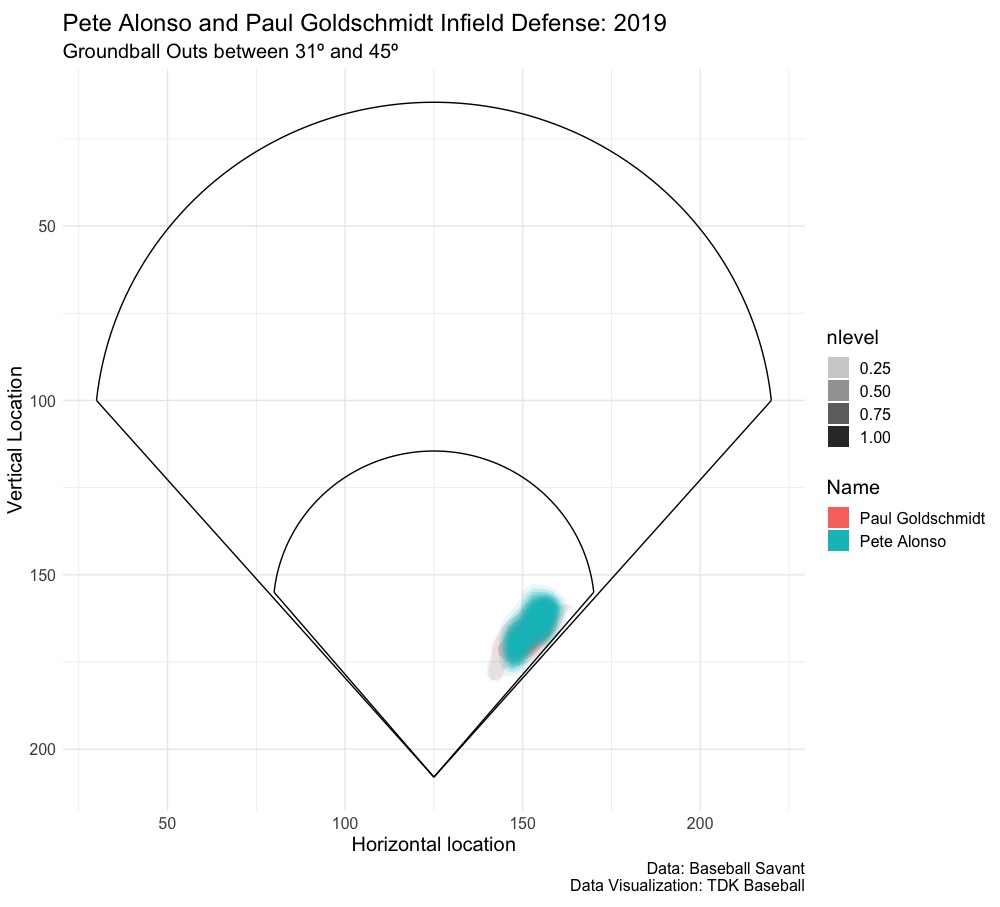
Alonso has two dense areas, which should indicate that he has starting positions further back and further in than say Goldschmidt. Here’s how the two compared in 2019:
Alonso overlaps with Goldschmidt, showing that range is limited for first baseman, but Goldschmidt does do a really good job coming in on the ball compared to Alonso. Using the Statcast OAA leaderboard, we see for these two players since 2018:
| Total | In | To Right | To Left | Back | |
|---|---|---|---|---|---|
| Goldy | 7 | 6 | 0 | 0 | 1 |
| Alonso | -7 | 1 | -6 | 0 | -1 |
Neither player goes to their left very well, just average, but Alonso per Statcast does struggle going to his right, something where needing the starting position would help with the heat and contour maps. The top five (among 22 with 50+ chances) and their ranking among the other metrics:
| HSPCAA | Rank | OAA Rank | DRS Rank | UZR Rank | |
|---|---|---|---|---|---|
| Christian Walker | 0.129 | 1 | 2 | 2 | 6 |
| Pete Alonso | 0.103 | 2 | 22 | 17 | 7 |
| Daniel Murphy | 0.098 | 3 | 13 | 8 | 12 |
| Joey Votto | 0.090 | 4 | 9 | 3 | 11 |
| Josh Bell | 0.076 | 5 | 20 | 21 | 22 |
The biggest surprise here Bell, who visually is not a good defender and was given a 40 present and 45+ future defensive grade in 2015 by Kiley McDaniel, then at FanGraphs. The eye test agrees that Bell’s defense shouldn’t be considered top five by first baseman, and unlike Alonso, none of the other three systems see Bell in top 10 and have him at the bottom of our 22 player list. This seems to be a flaw with modeling our first baseman defense in this fashion. Another example is Matt Olson ranking 20th but is first in the other three metrics.
***
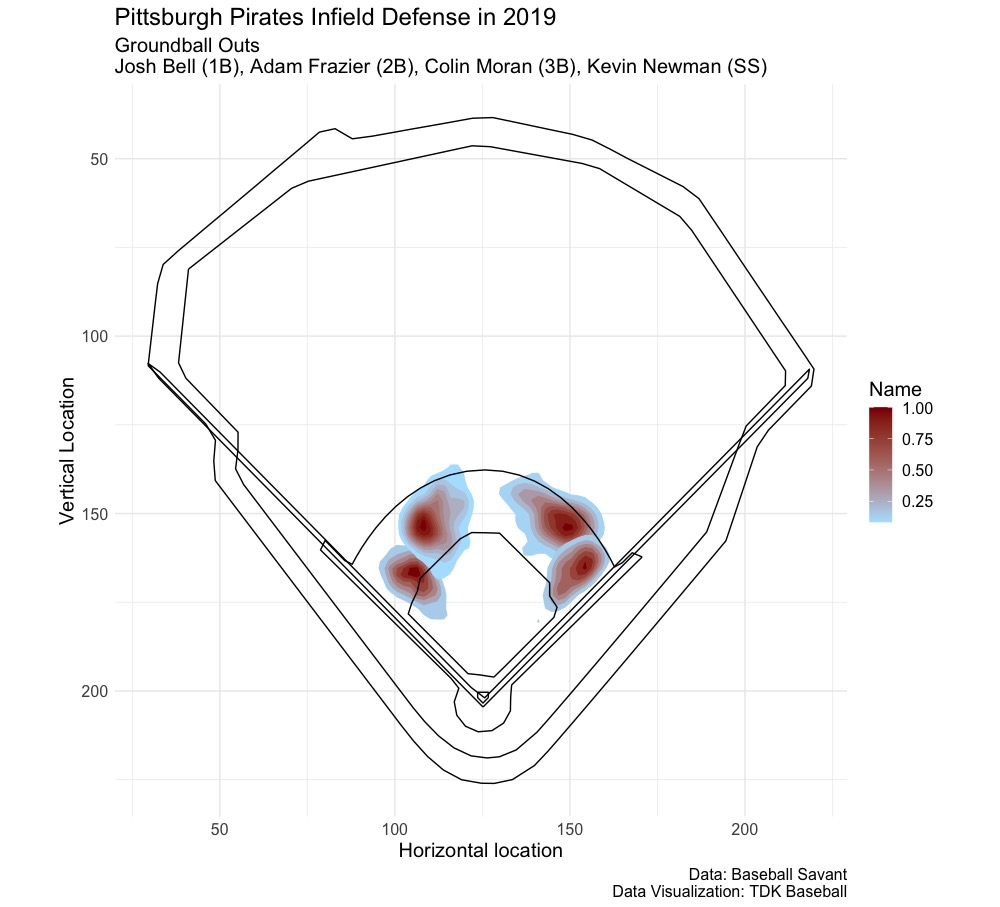
One other way to look at defense is plotting the defensive ranges by team. The Pirates main defensive lineup in 2019 was Josh Bell at first, Adam Frazier at second, Colin Moran at third, and Kevin Newman at shortstop. We get the following two heat maps:
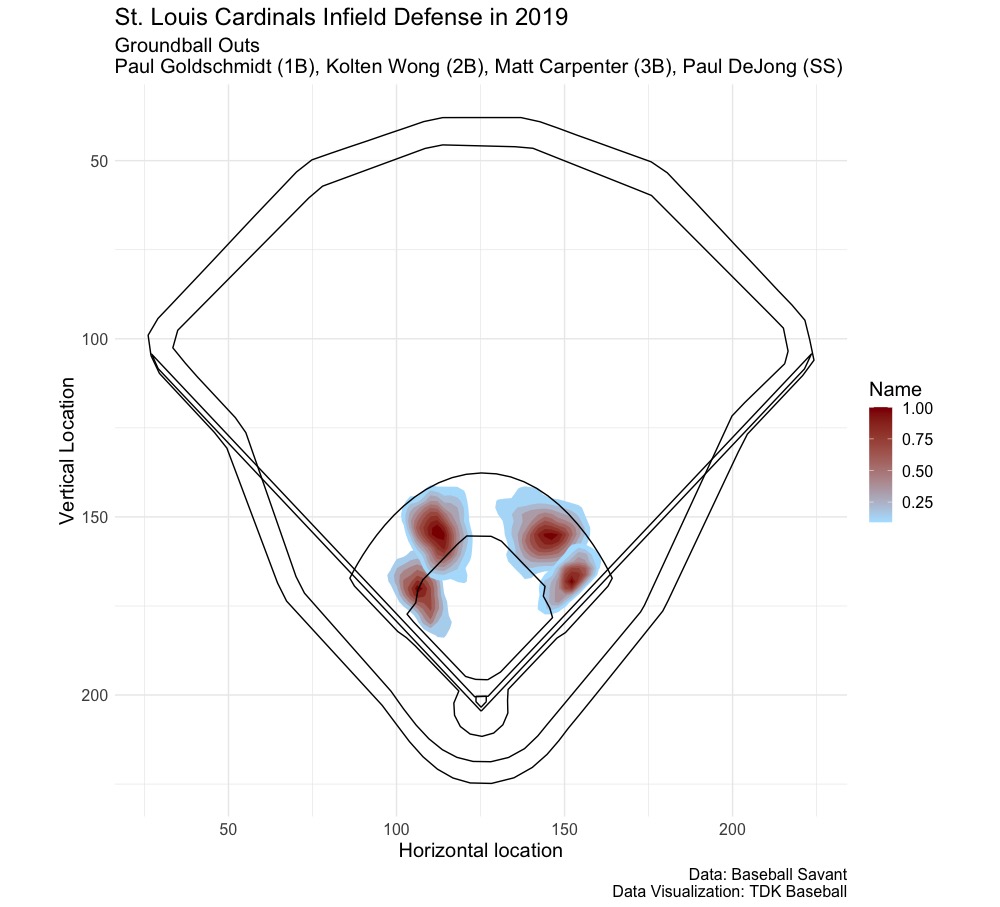
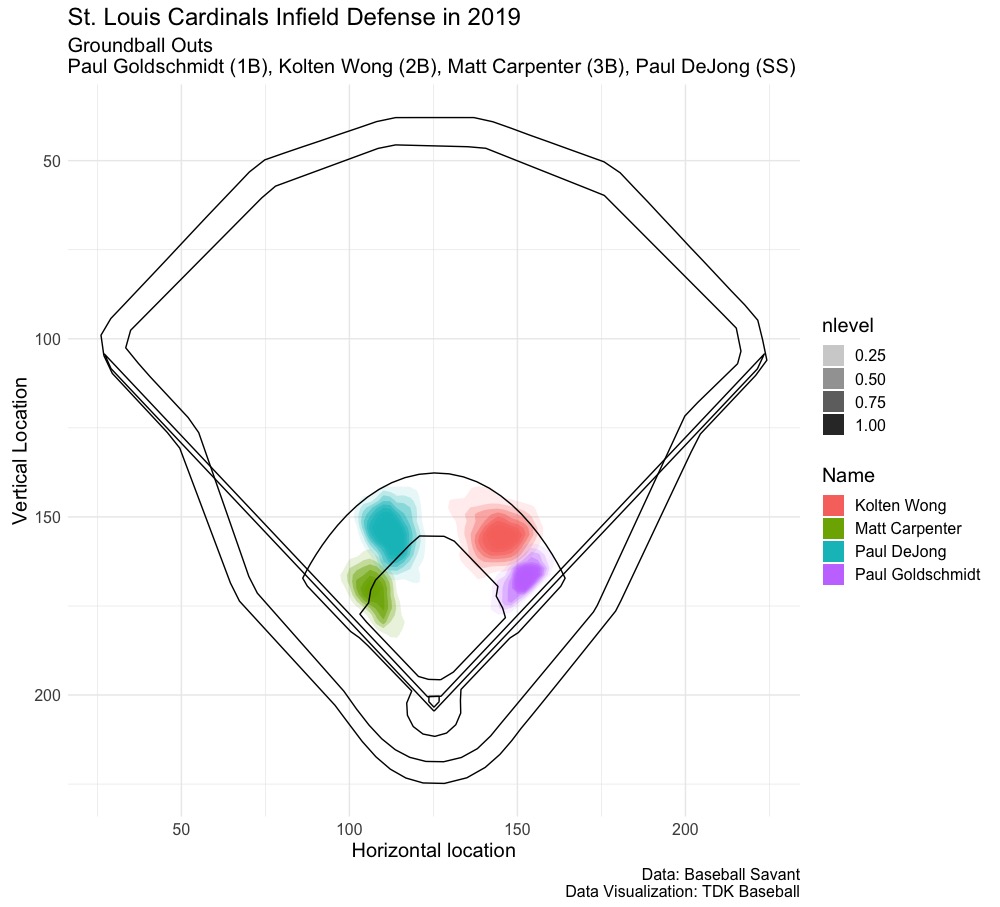
Let’s compare this with the St. Louis Cardinals, who have Goldschmidt at first, Wong at second, Matt Carpenter at third, and Paul DeJong at shortstop:
This can help better illustrate team defensive range. Carpenter (ranked 22nd in 2019 at -0.026 in HSPCAA) has similar defense to Moran (ranked 18th at -0.019), but Newman goes to his back left more than DeJong, who is overall a better defender (DeJong ranked 6th in HSPCAA at 0.052).
The model needs additional tuning, especially at first base, but also with balls where the third baseman cuts the shortstop off to get the out on a ball the shortstop would also make. I do think these data visualization techniques, if given the starting position of every batter, would help in seeing the range comparisons of players. For the Pirates, that could help in the decision of Kevin Newman or Cole Tucker at short and the other at second, or if Adam Frazier is better at second so move the other to the outfield, optimizing the defense.





Leave a Reply