Evaluating the 2020 MLB Draft: Understanding the Model
Last week, I gave my general thoughts about the draft and a deep review of the Pittsburgh Pirates draft, including a breakdown of what Nick Garcia, Jack Hartman, and Logan Hofmann’s Trackman data were. This post will be about updating the understanding of the model. In the initial post, I wrote that because model 1 explains more of the variance in the draft that it would be the used model going forward. The biggest difference is that model 1 makes positions less granular than the simple model. For instance, in model 1 a first baseman and third baseman would be considered a corner infield but in the simple model the positions would be first and third baseman accordingly. Looking at how the two models explained the variance in the 2020 draft, we get the following:
| First 50 Picks | First 160 Picks | |
|---|---|---|
| Simple Model | Pre 2020: 59.78% Post 2020: 64.13% | Pre 2020: 59.07% Post 2020: 53.31% |
| Model 1 | Pre 2020: 61.43% Post 2020: 65.00% | Pre 2020: 58.84% Post 2020: 53.69% |
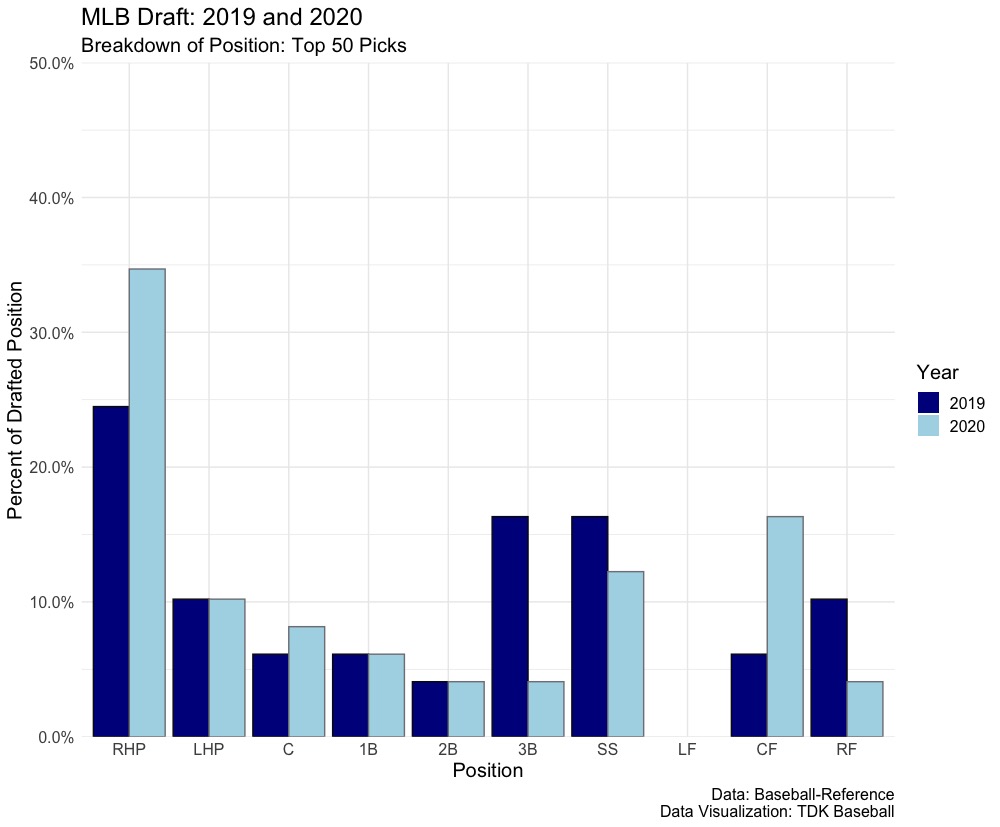
Model 1 outperformed the simple model again, but it hardly had the advantage, especially within the first 50 picks. Part of this seems to be from the distribution of positions in the draft:

In 2019, there were considerable less amounts of third baseman and right fielders taken in the top 50 in the draft. Third baseman fell from 16.3 percent to 4.1 percent, right field fell from 10.2 percent to 4.1 percent, and and center field rose from 6.1 percent to 16.3 percent.
For the entire draft, model 1 again does better than the simple model. However, where the simple model and model 1 get worse is outside the top 50 picks. In 2020, these two models performed worse than in 2019 when looking at the entire draft.
I believe that to be the case because of the special circumstances of the draft. The 2020 class was deep collegiately, but the lack of time to see the top high school players, potential higher bonus demands, etc. could lead the prep players back to school. According to the consensus board, the 11th (Tanner Witt, ranked 38), 12th (Carson Montgomery, ranked 42), and 16th (Kevin Prada, ranked 49th) ranked high school players didn’t get drafted. Using FanGraphs list as a proxy, all top 50 draft prospects got picked in 2019 and the top ranked high school player who wasn’t drafted, Brett Thomas, was ranked 114th. In 2020, FanGraphs had 10 high school prospects within the top 114 to not be drafted. The draft skewing heavy college seems to explain the gap between the first 50 picks and the entire draft, going back to what Passan said:
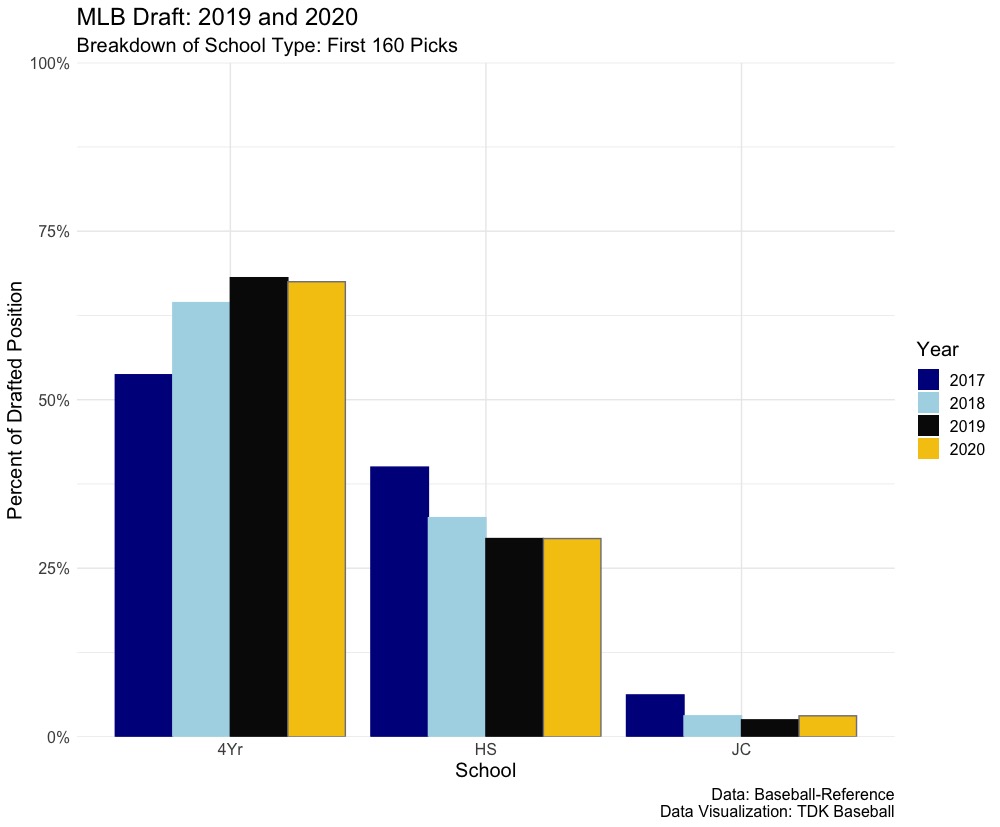
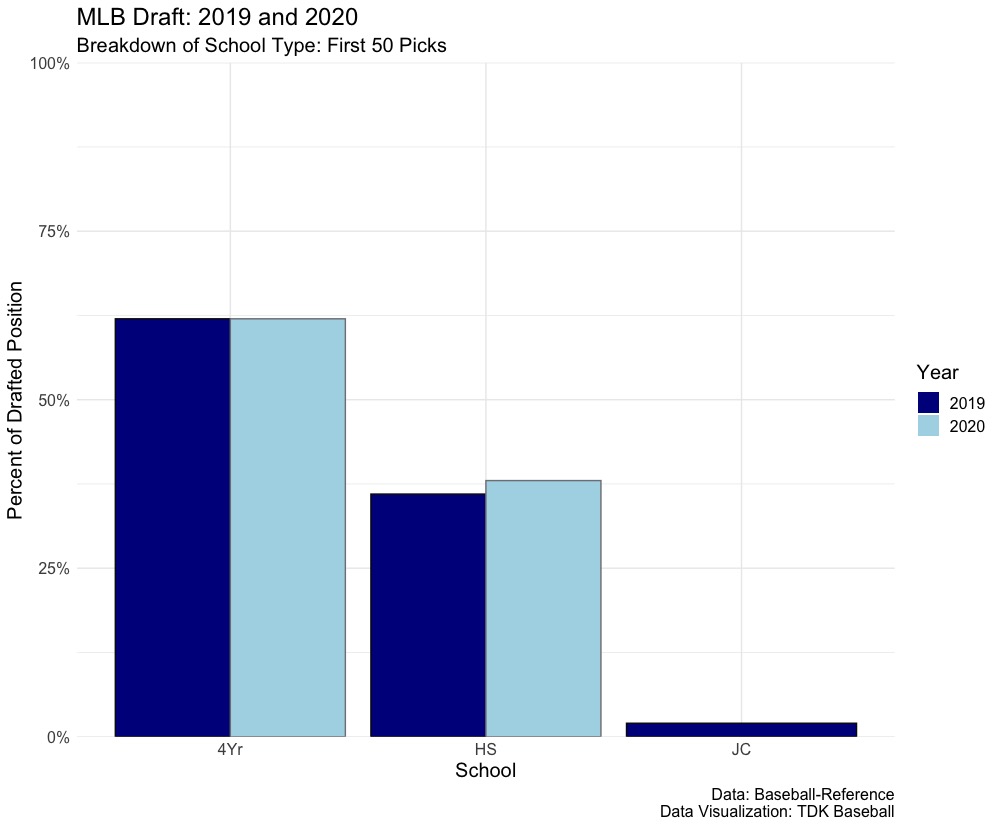
In 2019 and 2020, the breakdown was the same for the top 50 picks: 62 percent college, though with the junior college players, it adds up to 64 percent of the draft. Limiting to the first 160 picks – this way to help in controlling for in the past, teams would shift bonuses around and take senior sign guys in the mid rounds – we see that the 2020 MLB Draft had the lowest amount of high schoolers (29.4 percent) since 2000. Looking at the last four drafts, we see the trend:

The below table has the percent of high school players taken within the first 160 picks since 2000 (scroll the table to find the desired year):
| year | school_type | n | freq |
|---|---|---|---|
| 2012 | HS | 82 | 0.512 |
| 2000 | HS | 81 | 0.506 |
| 2002 | HS | 78 | 0.488 |
| 2001 | HS | 72 | 0.450 |
| 2011 | HS | 70 | 0.438 |
| 2007 | HS | 69 | 0.431 |
| 2013 | HS | 69 | 0.431 |
| 2010 | HS | 68 | 0.425 |
| 2003 | HS | 66 | 0.412 |
| 2014 | HS | 64 | 0.400 |
| 2017 | HS | 64 | 0.400 |
| 2015 | HS | 63 | 0.394 |
| 2006 | HS | 62 | 0.388 |
| 2009 | HS | 61 | 0.381 |
| 2004 | HS | 58 | 0.362 |
| 2005 | HS | 58 | 0.362 |
| 2008 | HS | 57 | 0.356 |
| 2016 | HS | 56 | 0.350 |
| 2018 | HS | 52 | 0.325 |
| 2019 | HS | 47 | 0.294 |
| 2020 | HS | 47 | 0.294 |
The 2012 Collective Bargaining Agreement saw a change in the draft, where there were hard bonus pools for the first 10 rounds (if look at the first 300 picks, 2012 falls to fifth highest, 2013 tenth, and 2014-2019 are the bottom six). It seems that, outside the Astros who took Carlos Correa first to spend money on Lance McCullers later, teams adapted to the strategy and targeted high schoolers later. After the 10th round, $100,000 (in 2012, changes following years), didn’t count against the bonus pool.
Since 2019 and 2020 were both at 29.4 percent, and a decrease from 2018 at 32.5 percent, but 2017 was at 40.0 percent and without more serious analysis outside the scope of this post, it can’t be deduced that the lack of high school players taken is why the model explained less of the variation in the first 160 picks. I think the reasoning is the lack of scouts seeing players and boards, in this case FanGraphs, not matching with how teams view players. The lack of consensus and sourcing to get to a general view is what seems to be more of a driving force.

Leave a Reply