Data Visualization: 2021 PECOTA Projections
Yesterday, Baseball Prospectus has released their 2021 PECOTA Projections. Darius Austin wrote a good primer on depth charts and playing time inputs that are put into the model, a human and not machine led process. It’s a good primer to start. Jonathan Judge then wrote about the 2021 projections, one about how a short season (2020) influences 2021 projections. Instead of setting weights, PECOTA looks for trends over some time series for a player that is used to project in period t+1.
The biggest thing with PECOTA is the release of their percentile projections, which allows us to estimate a distribution. If we assume the Central Limit Theorem (CLT), we’ll get normality if the sample size is large enough (we’re going to run 10,000 simulations). The best way to run the simulation is having a known mean and standard deviation, which are not present. But since we’re assuming a large enough number of simulations and the CLT, the median (or 50th percentile) is the mean. To get the standard deviation, we will have to back calculate it based on a z-score. Since PECOTA releases their percentiles, we’ll use the 10th percentile and the median.
z = (x – μ) / σ => σ = (x – μ) / z. Plug in the 10th percentile for x and 50th percentile for μ. The z-score for the 10th percentile, using the z-table, we see that z = -1.282. As a result, out formula is z = |(10th percentile – 50th percentile) / -1.282| (note, I’m putting in absolute value because for the pitchers and DRA, where lower is better, the SD will be negative and we want the positive SD for the simulation.
Then running a 10,000 simulation, we can get plots illustrating uncertainty (similar to what Judge had for Kershaw and Kopech). The below looks at hitters of interest with the 100 (league average) line in red:
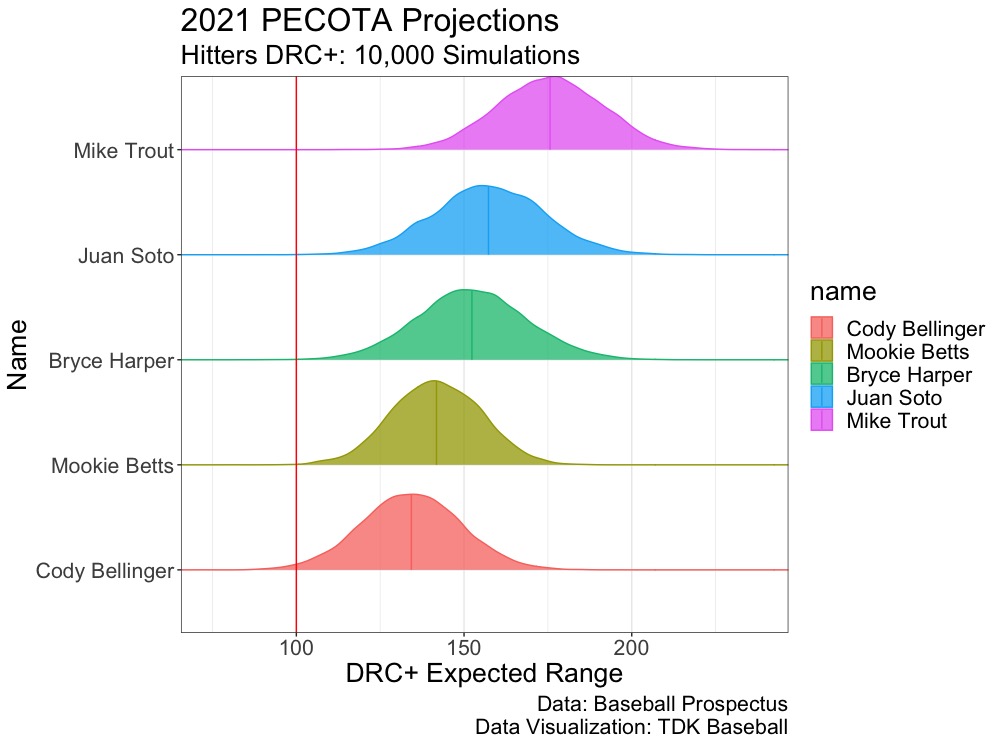
These aren’t the top five projected hitters but rather five interesting hitters. Harper is fourth in DRC+ median projection but only 17th in WARP given the projected -10 FRAA. The bat is still legit (148 DRC+ in 2020 with the Phillies and an estimated wOBA of .451) there are just concerns on the glove. Bellinger, on the flip side, is projected eighth in WARP despite being 18th in DRC+. He projects for 4.5 FRAA while playing a premium position in center and can also swing around and play first base).
On the pitcher side, I’ve added the red line to be at 4.89 (2020’s RA9, though one could project the league RA9 from the PECOTA 2021 projections).

Jacob deGrom remains elite, with the best projected DRA (remember it’s on the RA9 scale) with Bieber, Nola, and Cole being projected the same DRA with roughly similar distributions. Giolito trails the the four and is fifth among pitchers selected (note, these are not the top five projected pitchers).
Illustrating the distributions helps lead to a better of uncertainty, especially in a forecast. The full code for these plots is on my GitHub, just change the data location to match yours.
0 Comments on “Data Visualization: 2021 PECOTA Projections”