Prospect Theory: The Importance of the Wisdom of Crowds
James Surowiecki wrote The Wisdom of Crowds back in 2004 discussing the power that crowds have over one person when it comes to predictions and there are three conditions that need to be met for a wise crowd:
- Diversity
- Independent
- Decentralization
As time goes on, the market will weed poor actors as a signal of productivity (think of it as two financial investors, one will go bankrupt). Additionally, Nate Silver, in his book The Signal and the Noise, discusses the aggregation of forecasts and this aggregation is better than using the forecast from just the top pundit. J.S. Armstrong, of Wharton, finds that combined forecasts are never less accurate than a single forecast and are usually more accurate, especially when there are large uncertainties. Tae-Hwy Lee of California Riverside looks at combining forecasts with multiple predictors, and notes that while simple averaging does work well most of the time, there are problems by assuming all forecasts are equally good.
Markets perform better than individuals and aggregating opinions can help an organization make better decisions and remain healthy. These combined forecasts are more accurate and work even without the proper weighting and assuming each forecast is just as good as one another. The best predictor isn’t a single one but rather multiple predictors combined into one.
***
The relevance to prospects comes in the form of different sites, with the biggest names being Baseball America, MLB Pipeline, FanGraphs (Eric Longenhagen), ESPN (Kiley McDaniel), and The Athletic (Keith Law). Baseball Prospectus (Jeffrey Paternostro and team) and Prospects Live also have prospect coverage and produce lists of information. Aggregating information – in this case just scouting lists – allows fans to see how the different outlets view a farm system or a particular prospect. Within a team structure, aggregating the scouting information and analytical information (note: analytics is just information) provides an insight into a player.
Further, scouts have different backgrounds and different characteristics in player evaluation that they like (diversity), scouts make their own judgements and do not rely fully on another scout (independent), and scouts do specialize (pitcher and hitter) and display some level of tacit knowledge (not everybody who watches baseball can scout) and thus they are decentralized.
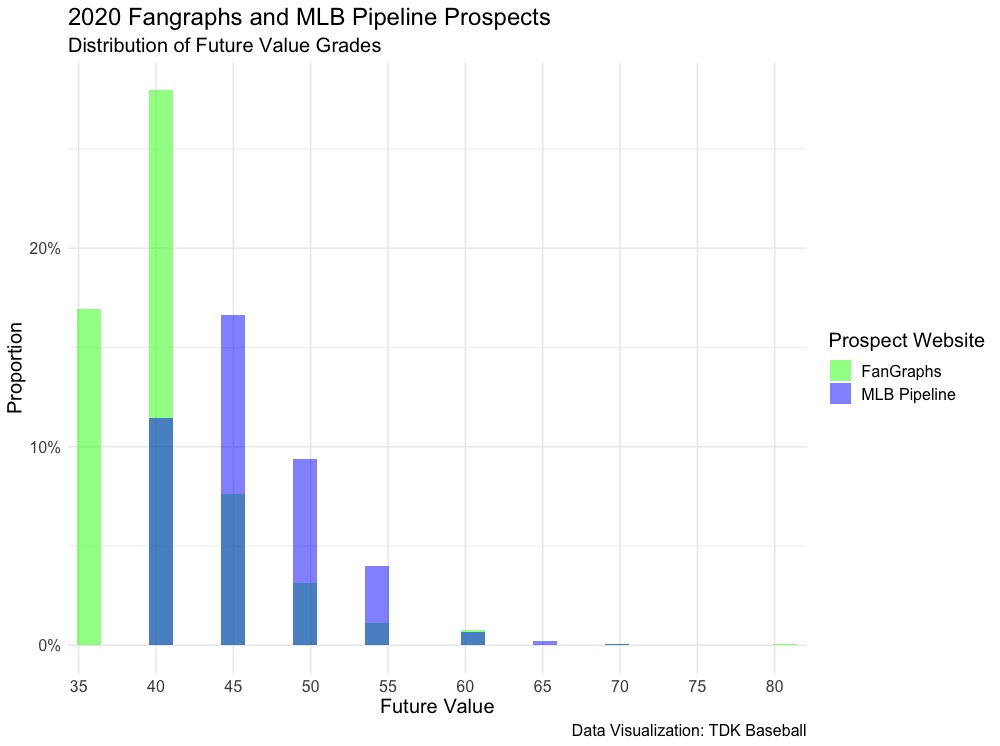
We can see these qualities when looking at public prospect rankings. Let’s look at FanGraphs and MLB Pipeline’s end of 2020 prospect lists (removing the prospect graduates):

As we see, MLB Pipeline has more prospects in the 45, 50, and 55 tiers compared to FanGraphs, who has more prospects graded as 35 and 40’s (note: I’ve transformed FanGraphs’ 35+ grades to 35, 40+ grades to 40, and 45+ to 45 to better compare the sites). From a numerical perspective, instead of just the quick visualization of the distribution, 48 percent of FanGraphs prospects (1,222 total that are ranked) are seen as 40 FV whereas 39 percent of MLB Pipeline’s prospects (900 total that are ranked) are seen as 45 FV:
| FV | FanGraphs | MLB Pipeline |
|---|---|---|
| 35 | 29.40% | 0.00% |
| 40 | 48.50% | 27.00% |
| 45 | 13.30% | 39.20% |
| 50 | 5.40% | 22.10% |
| 55 | 1.96% | 9.44% |
| 60 | 1.31% | 1.56% |
| 65 | 0.00% | 0.56% |
| 70 | 0.08% | 0.11% |
| 80 | 0.08% | 0.00% |
The lone 80 grade from FanGraphs is Wander Franco, an elite shortstop prospect from the Tampa Bay Rays that has done nothing but hit at levels in which he is well below the typical prospect age. But knowing this distribution is important, especially for fans discussing prospects that are either being recalled by their favorite team or for those discussing trades surrounding prospects. MLB Pipeline is more aggressive, and of their 900 prospects with a Future Value grade, the website sees 33.77 percent as MLB average or better (a FV of at least 50) whereas FanGraphs only has 8.83 percent of rated prospects as at least a 50.
By just using MLB Pipeline, it would appear that grades are artificially pushed up – the odds of being an average MLB player are low – but just using FanGraphs succumbs the user to that website’s biases. One way to complement the ratings is to use empirical methods to generate a distribution of the FV outcomes, though a model has its own bias in terms of the inputs used. There is also less time to eliminate the bad scouts, as the length in time to properly evaluate each scout is costly. Thus, aggregation and combining forecasts can provide for better assessment on how a player is expected to perform.
Similar to using multiple outlets to get an understanding of a prospect, a prospects trade value follows similarly. Craig Edwards has done research produced at FanGraphs but Driveline Baseball has calculated their prospect value model, and has combined their model with Edwards for a hybrid valuation.
As we can see, just using one prospect valuation source is not enough, as each list has their own form of biases. Instead, aggregating the valuations and determining how good a prospect really is matters; as scouts do have certain anchor points in their heads on what makes a quality Major League player. Additionally, adding analytical models with what a scout sees creates more diversity and understanding the player’s true valuation. Continuing to create a diverse group where there is collaborative decision making will yield the best results in team building and assessing which prospects and players to keep (or acquire) and those to trade.
Leave a Reply